CATEGORY
Hydraulic and Pneumatic Components Market
A hydraulic system is a transmission system that uses pressurized hydraulic fluid to power hydraulic machinery.A pneumatic system is a collection of interconnected components using compressed air to do work for automated equipment. Hydraulic and Pneumatic Equipment andcomponents include pumps, pressure regulators, control valves, actuators, and servo-controls.
Beroe LiVE.Ai™
AI-powered self-service platform for all your sourcing decision needs across 1,200+ categories like Hydraulic and Pneumatic Components Market.
Market Data, Sourcing & Supplier Intelligence, and Price & Cost Benchmarking.
Schedule a DemoHydraulic and Pneumatic Components Market Industry Benchmarks
Savings Achieved
(in %)
The average annual savings achieved in Hydraulic and Pneumatic Components Market category is 5.00%
Payment Terms
(in days)
The industry average payment terms in Hydraulic and Pneumatic Components Market category for the current quarter is 67.5 days
Compare your category performance against peers and industry benchmarks across 20+ parameters on Beroe LiVE.Ai™
Category Strategy and Flexibility
Engagement Model
Supply Assurance
Sourcing Process
Supplier Type
Pricing Model
Contract Length
SLAs/KPIs
Lead Time
Supplier Diversity
Targeted Savings
Risk Mitigation
Financial Risk
Sanctions
AMEs
Geopolitical Risk
Cost Optimization
Price per Unit Competitiveness
Specification Leanness
Minimum Order Quality
Payment Terms
Inventory Control
The World’s first Digital Market Analyst
Abi, the AI-powered digital assistant brings together data, insights, and intelligence for faster answers to sourcing questions
Abi is now supercharged with GPT4 AI engine. Enjoy the ease of ChatGPT, now on Abi
Hydraulic and Pneumatic Components Market Suppliers

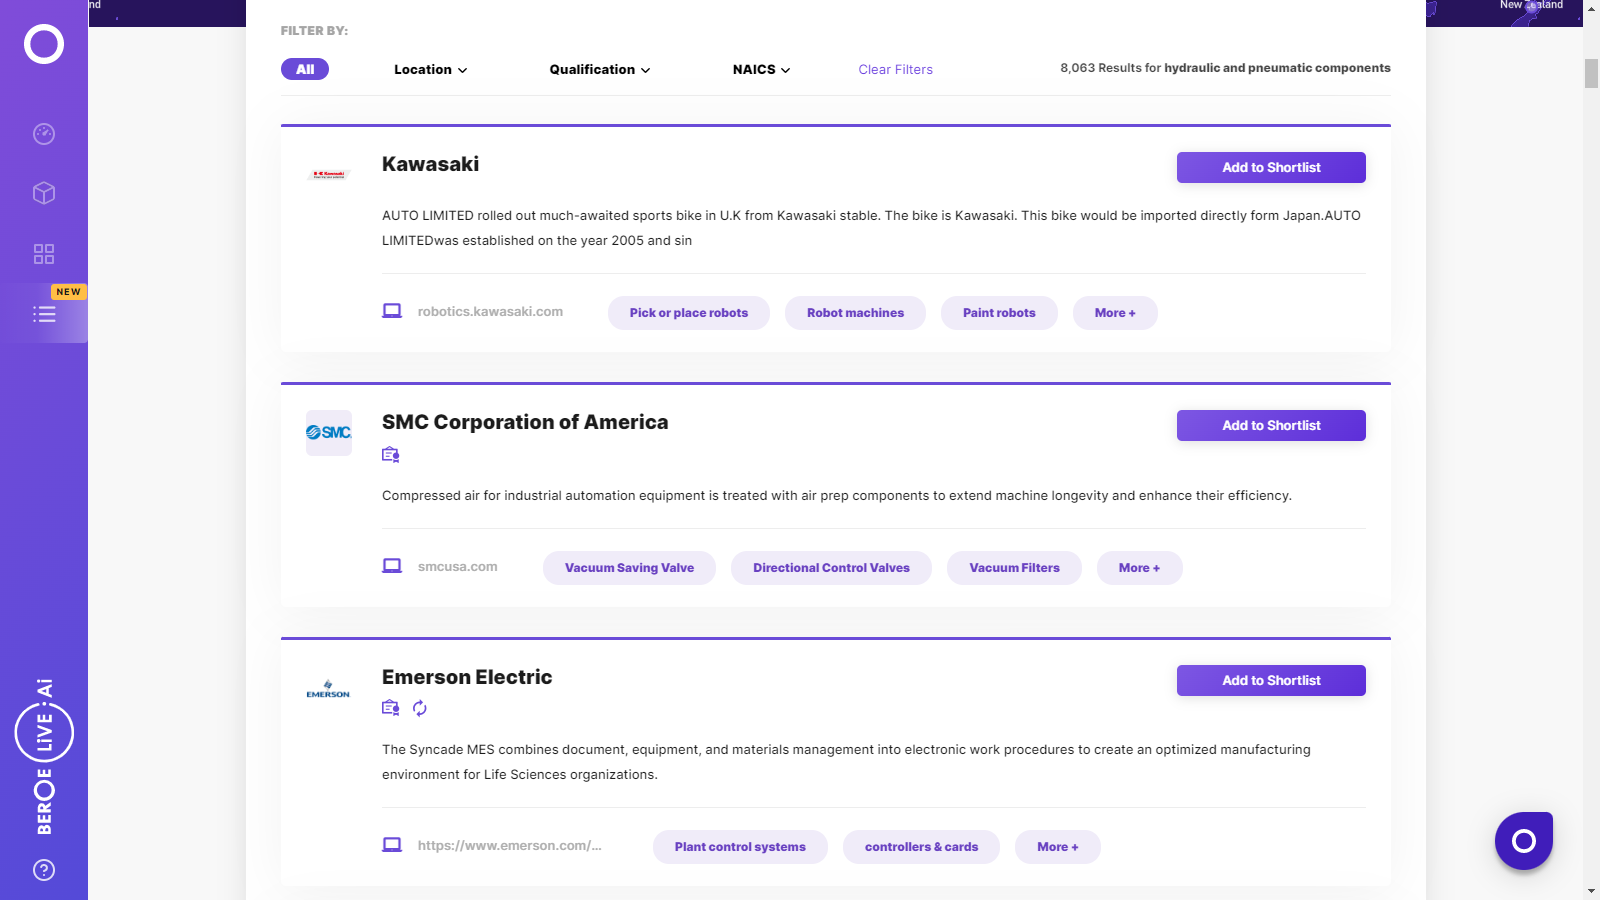
Find the right-fit hydraulic and pneumatic components market supplier for your specific business needs and filter by location, industry, category, revenue, certifications, and more on Beroe LiVE.Ai™.
Schedule a Demo


Use the Hydraulic and Pneumatic Components Market market, supplier and price information for category strategy creation and Quaterly Business Reviews (QRBs)
Schedule a DemoHydraulic and Pneumatic Components Market market report transcript
Hydraulic and Pneumatic Components Global Market outlook
MARKET OVERVIEW
Global market size: Approx. $50.28 billion (2022E)
Expected to grow at a CAGR of 5-6% to $59 billion by 2025
-
Europe will continue to dominate the market, in terms of growth prospects in pneumatic equipment consumption, until 2025. The Middle East and Africa (MEA) and APAC regions are expected to grow at the fastest CAGR until 2025
-
Increasing focus on bringing in more productivity and eliminating hazardous manual tasks are expected to be the major drivers in the coming few years

Hydraulic and Pneumatic Components: Industry Trends
-
Increasing levels of focus on improving mine safety in developed regions, like North America and Western Europe, signal an increasing buyer maturity and willingness to partner with automation suppliers
-
Global suppliers are entering new geographies in developing regions, such as Chile, Brazil, India, etc., through mergers and acquisitions, thus offering multi-location solutions to global buyers
-
The fragmented pneumatic and lubrication market in APAC and the MEA has provided a great opportunity for global OEMs and suppliers to tap into this market
-
These regions are considered to be developing, in terms of adopting automation to improve on oil exploration, mine safety, offshore mining, etc., instead of adopting conventional mining approach
Hydraulic and Pneumatic Components: Overview
-
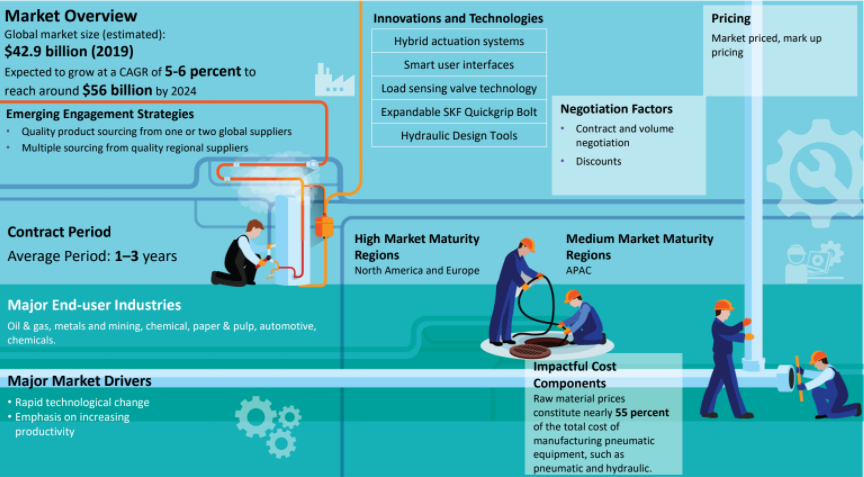
The hydraulic and pneumatic equipment market is estimated to be valued at $50.28 billion in 2022 and is expected to grow at a CAGR of 5–6 percent to reach around $59 billion by 2025
-
Upcoming Brownfield and Greenfield projects in the oil & gas and power generation industries are expected to sustain the demand. This growth is also due to technological advancement and miniaturization & automation in equipment design worldwide
- Oil & gas, mining, and chemicals contributed to almost 70 percent of the market size. The emerging middle-class population, generally, consumes more processed and packaged foods, which is leading to accelerated investment in the food & beverage segment of process equipment.
Hydraulic and Pneumatic Components: Market Maturity
-
The pneumatic equipment market is estimated to be valued at $50.28 billion in 2022* and is expected to grow at a CAGR of 5-6 percent to reach around $59 billion by 2025
-
North America accounts for 35 percent of the market share in 2021. The pneumatic equipment is fragmented and is competitively catering to a variety of industries with vast end-user segments across industries, such as oil & gas, mining, cement, paper & pulp, etc.
Procurement Strategy: Overview
Sourcing Strategy
-
Global suppliers are preferred because they can cater to the needs and demands of the global customers
-
Global supplier not only helps in standardizing the products across the sites but also helps in sped pool consolidation
Supplier Preference
-
One to two suppliers are preferred, as they can help in improving the design of the machines
-
The negotiation power will be less with multiple suppliers
Engagement Model
-
Large buyers first prepare the list of preferred components suppliers. The list is prepared, based on the performance of equipment's used in previous plants or an expert’s advise. The list is given to the integrators and is advised to use components of selected suppliers only in their equipment
-
The integrators manage the procurement of these components on behalf of the customer. A repair, replacement or warranty issue is also managed by Integrator. In this way, they act as a single point of contact for the customer for every problem
Pricing Models
-
The equipment/machineries are bought through bidding process where the least cost supplier generally wins the contract
-
The pricing model is fixed. The pricing depends on the design specifications and requirements
Hydraulic and Pneumatic Components Market Overview: Hydraulic Cylinders and Components
-
The hydraulic cylinder market is estimated to be valued at $18.45 billion in 2022 and is expected to reach $21.96 billion by 2025, at a CAGR of 5–6 percent until 2025.
-
North America is the largest regional subsector with an estimated 29 percent market share in 2021, followed by Europe at 25 percent
-
The Asia-Pacific market is the third largest regional subsector with 21 percent market share. It is expected to have the greatest rate of growth, approximately 7 percent over 2021–2025
-
The hydraulic cylinder market is estimated to be valued at $18.45 billion in 2022 and is expected to reach $21.96 billion by 2025, at a CAGR of 5–6 percent until 2025
-
Steady growth is attributed to continuous demand from agriculture, construction equipment, mining equipment, material-handling equipment, industrial equipment, aerospace, and defense sectors
Interesting Reads:
Discover the world of market intelligence and how it can elevate your business strategies.
Learn more about how market intelligence can enable informed decision-making, help identify growth opportunities, manage risks, and shape your business's strategic direction.
Get Ahead with AI-Enabled Market Insights Schedule a Demo Now
