Module
Category Watch
Leverage always-on intelligence and analytics to proactively identify opportunities and manage risks in your categories.
Category Watch
Persistent global uncertainty is severely straining procurement teams, making it increasingly difficult for category managers to stay informed and make agile decisions.
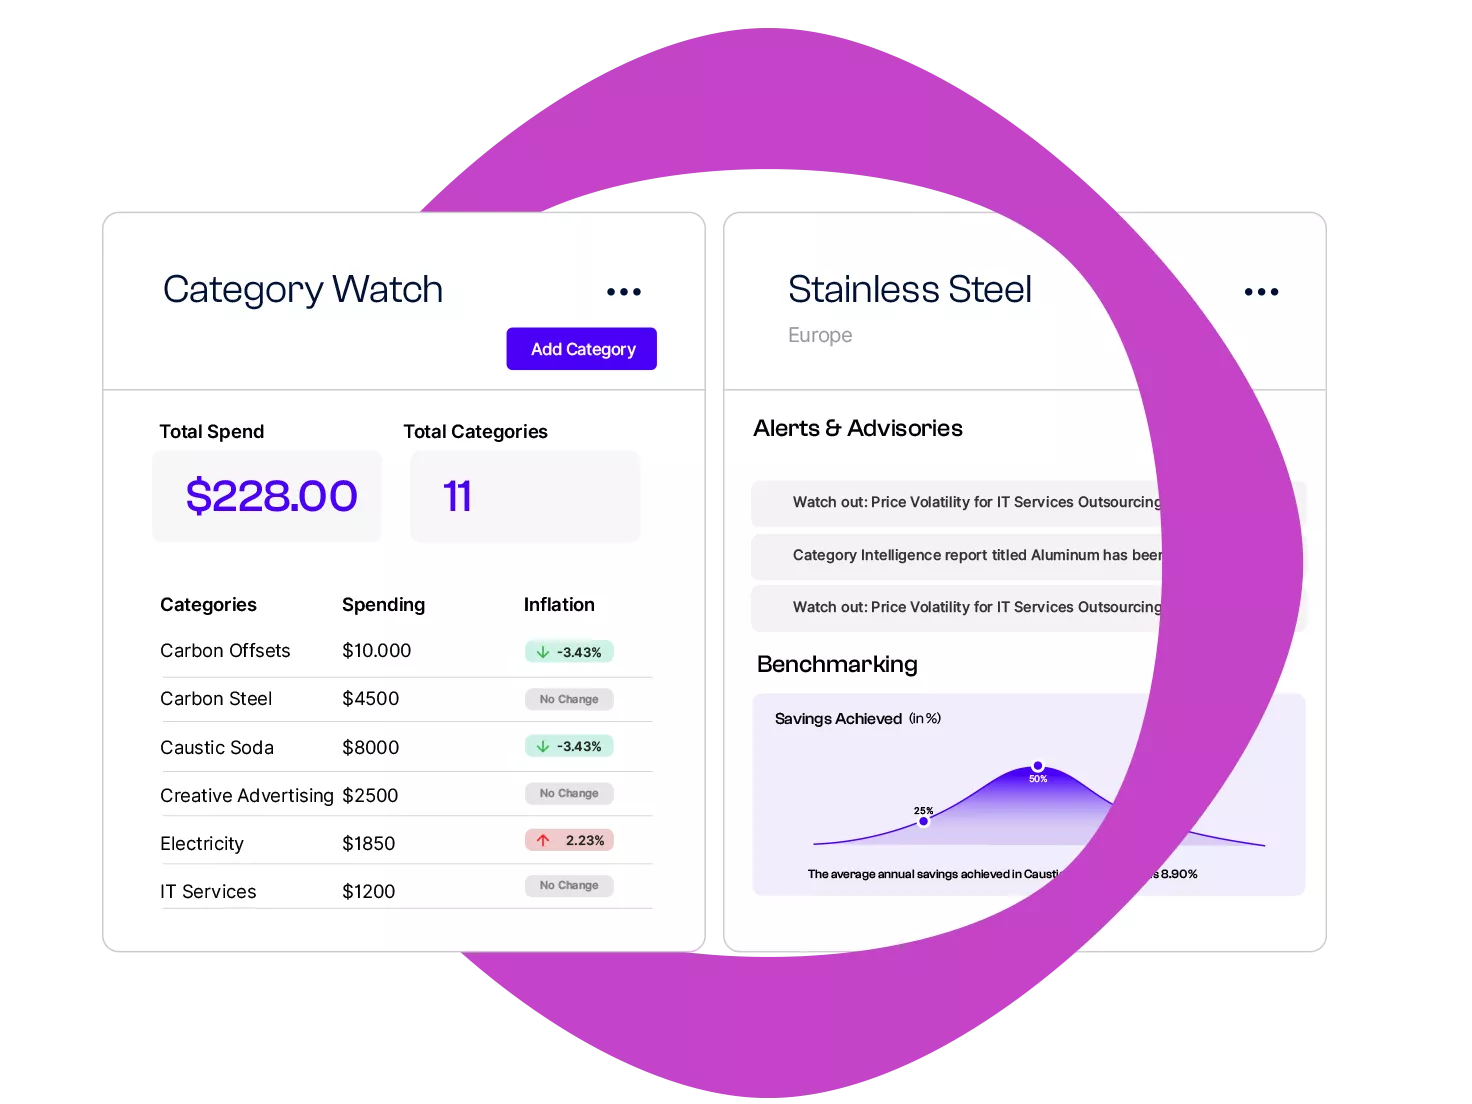
Beroe’s Category Watch, powered by AI and enhanced by human ingenuity, delivers a comprehensive view of your categories through its four specialized sub-modules: Category Insights, Geopolitical Alerts, Benchmarking, and Alerts & Advisories. Align your category strategies, uncover opportunities on an ongoing basis, and navigate market risks with precision.

Category Insights
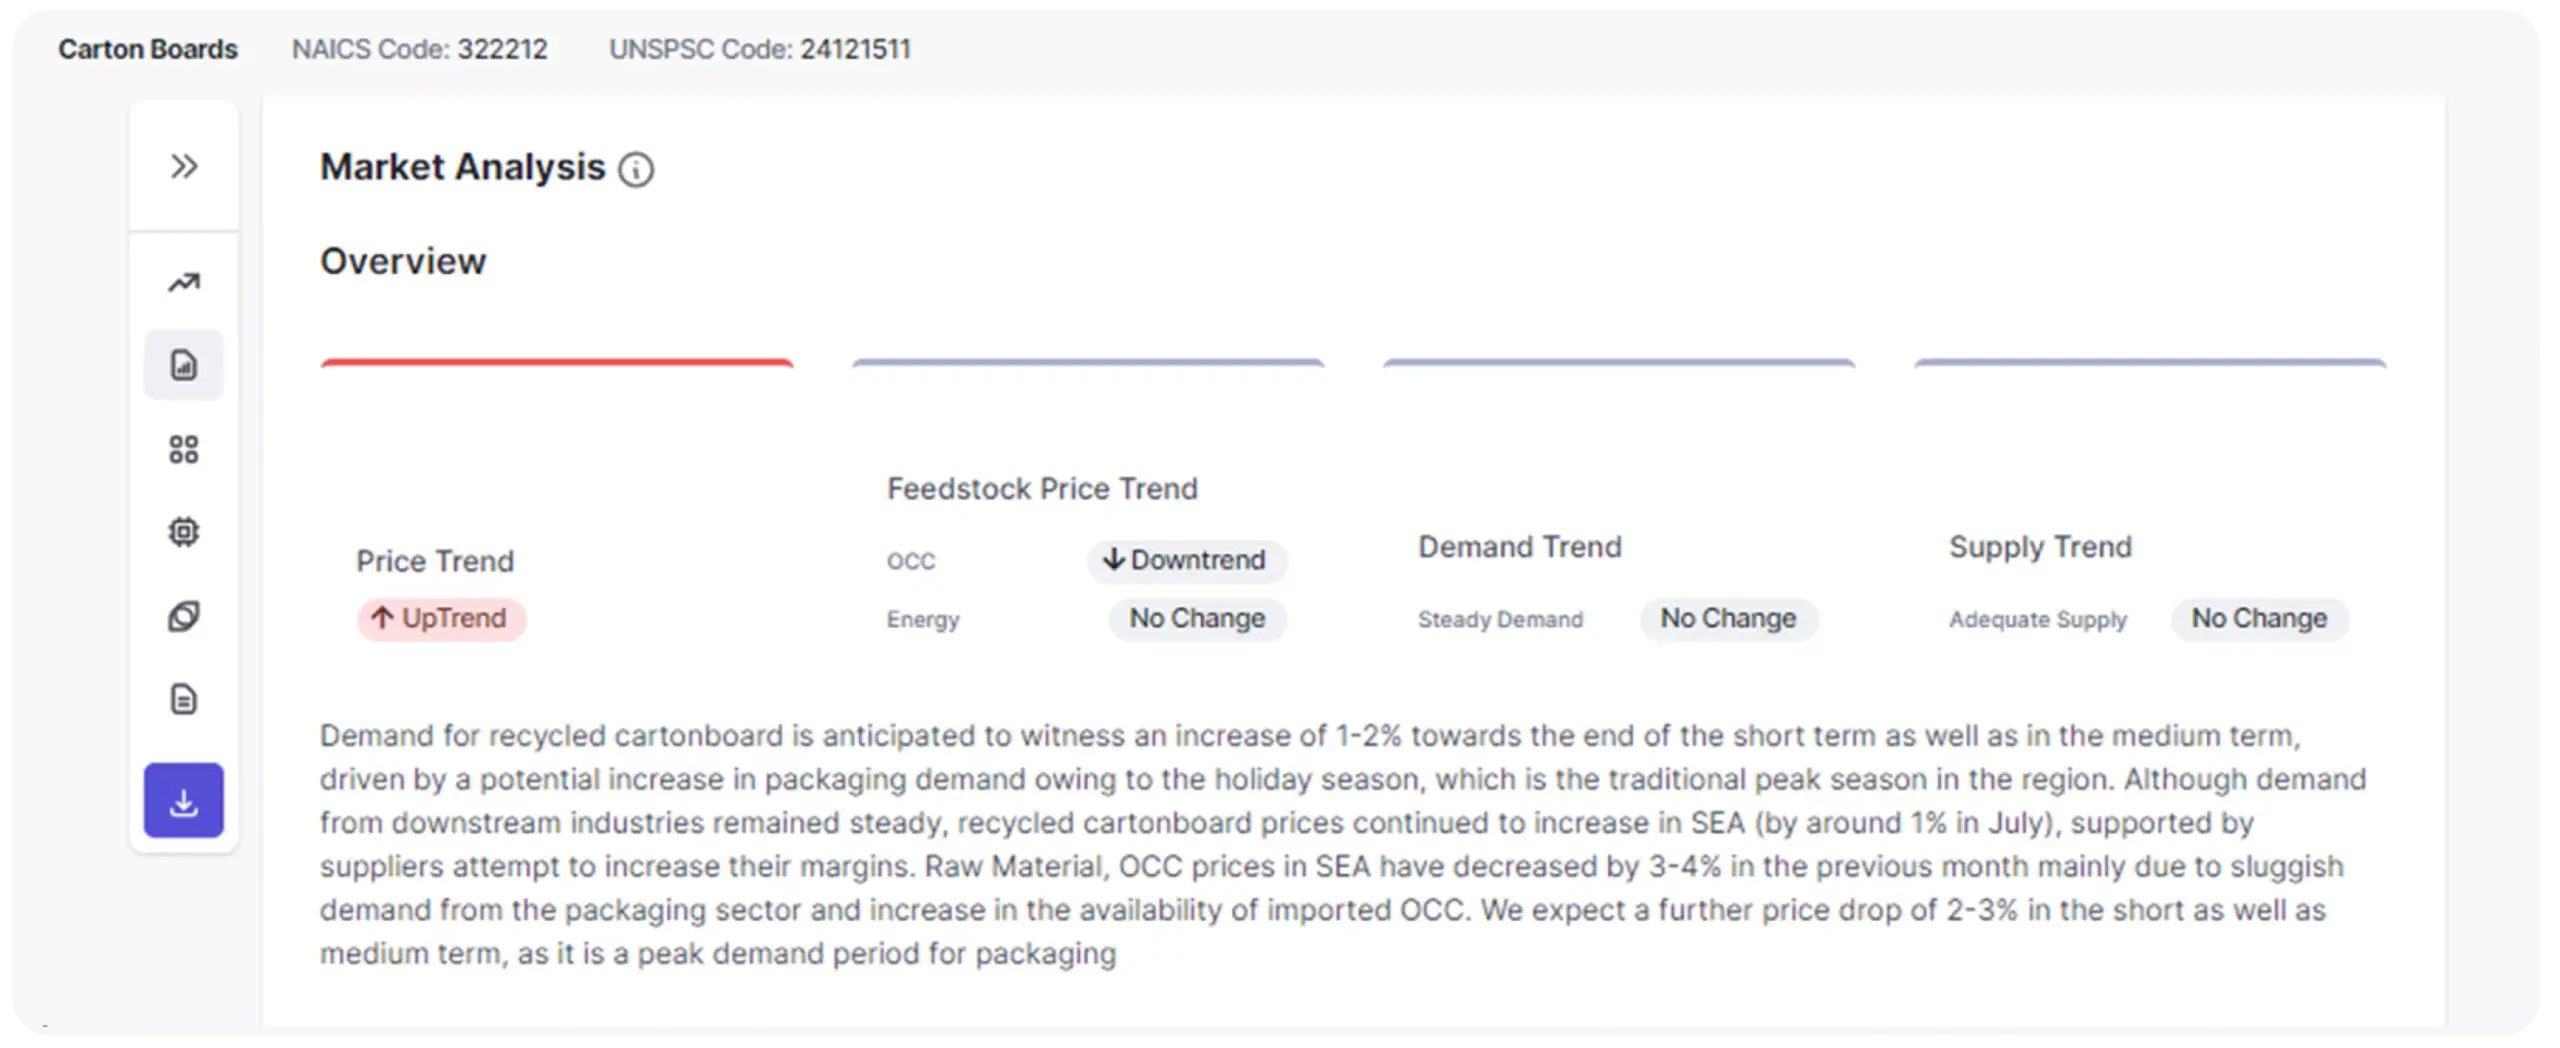
Benefit from in-depth knowledge across more than 2,500 categories, gaining a panoramic view of market trends, cost fluctuations, and evolving dynamics to capitalize on cost-saving/avoidance opportunities and minimize risks.

Geopolitical Alerts
Build a robust category strategy by staying ahead of global risks with a 360-degree view of geopolitical and economic factors. Enable procurement teams to identify savings opportunities and avoid material shortages with actionable intelligence that helps smarter category management.

Benchmarking
Evaluate your procurement performance against industry standards with 18 essential questions, uncovering gaps and providing actionable insights to refine your category management practices.

Alerts & Advisories
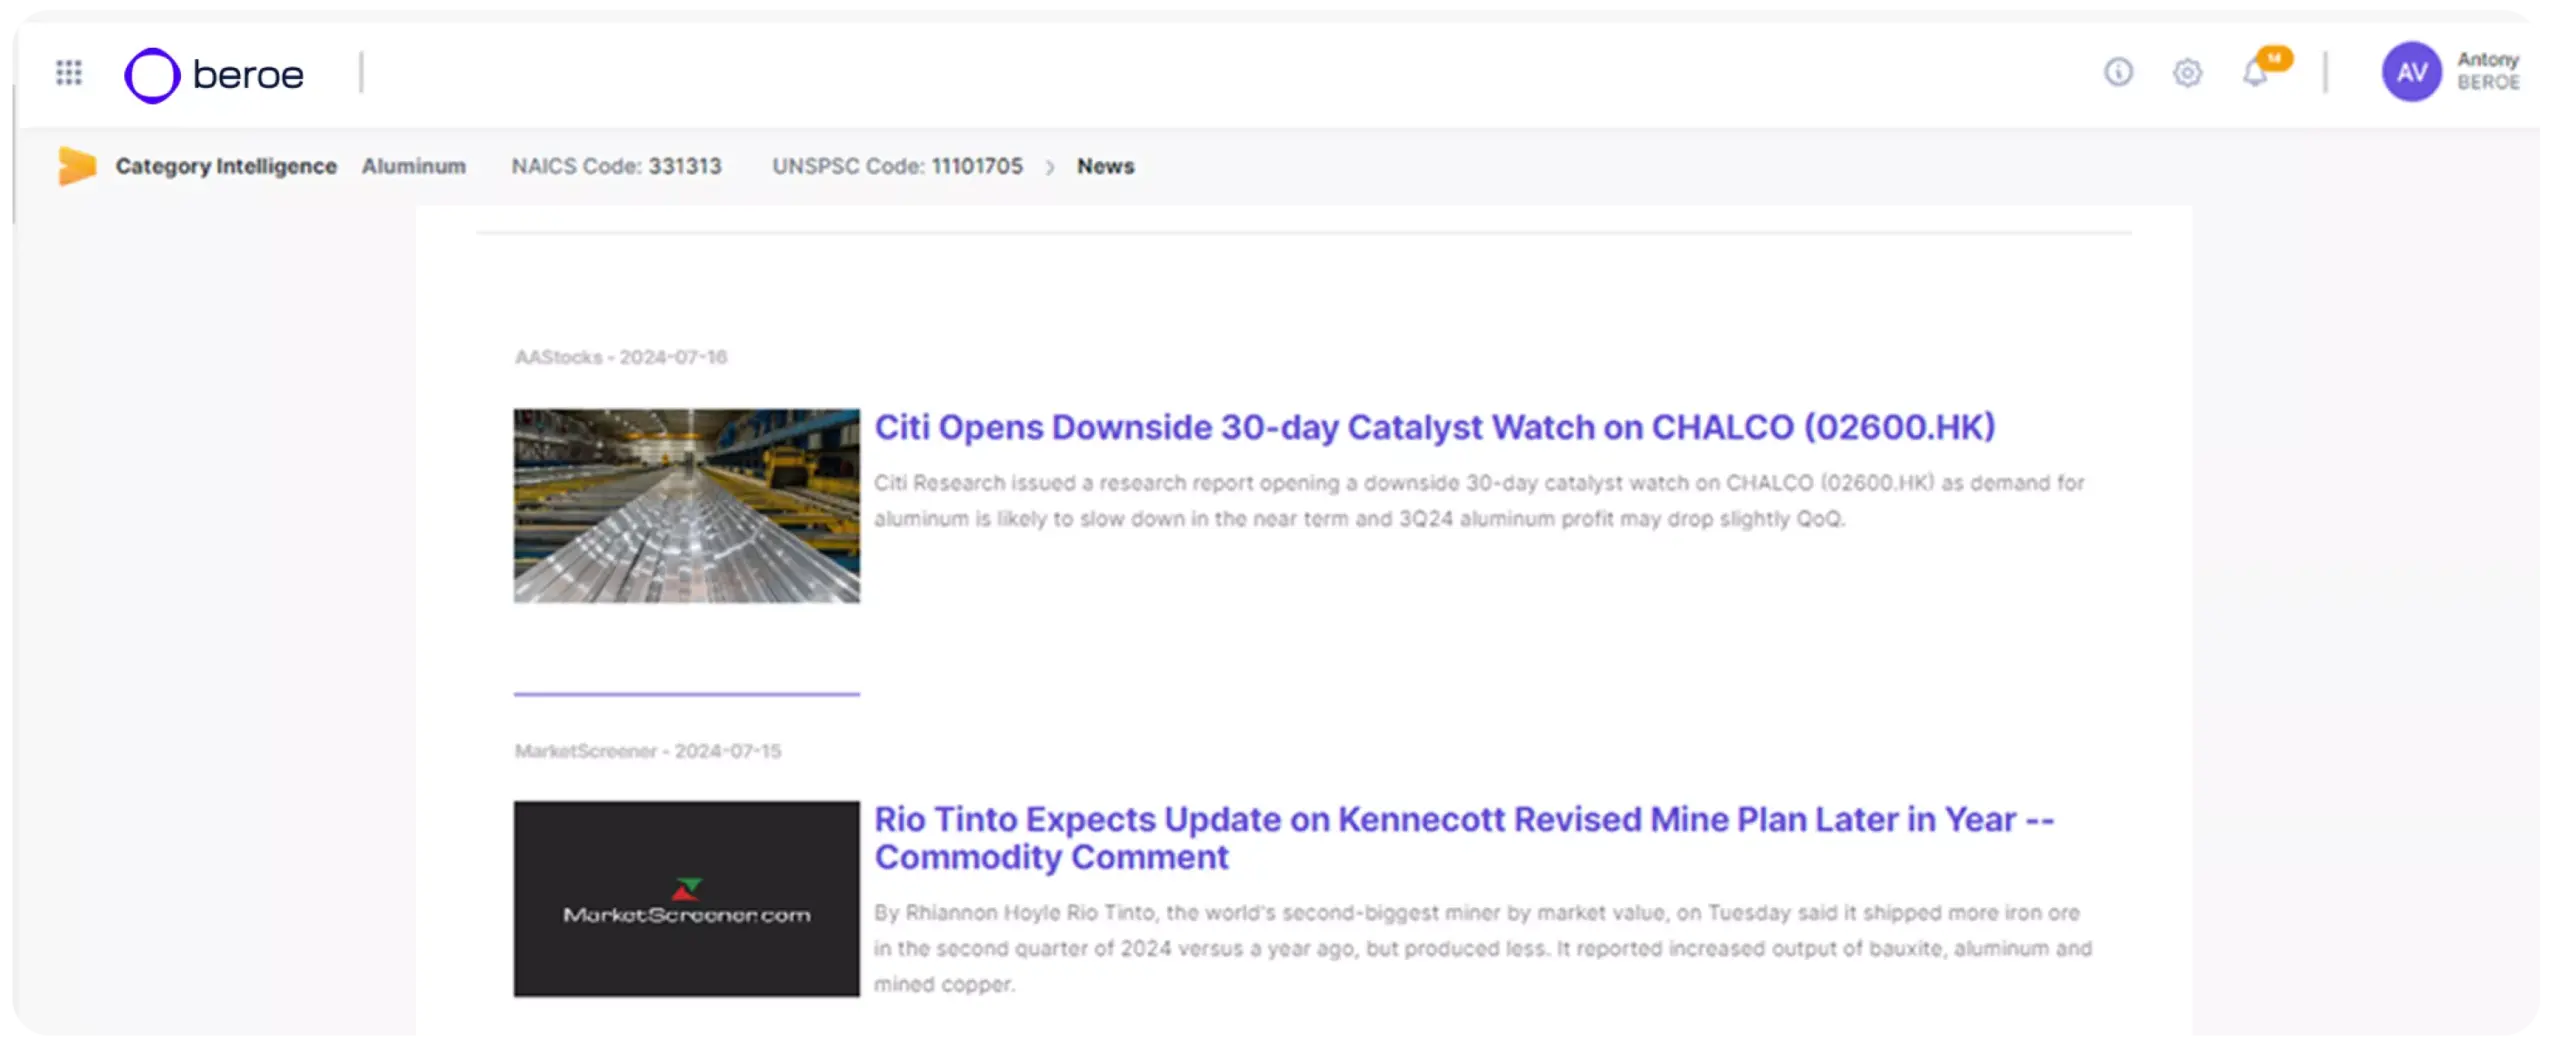
Stay informed with Abi’s timely alerts. Receive daily news, proactive supplier alerts, and strategic insights to adjust sourcing locations, negotiate better contracts, and maintain supply assurance.
2,500
Comprehensive insights into 2,500 direct and indirect categories.
1,000+
Empowering over 1,000 procurement organizations with cutting-edge category intelligence.
40,000+
Engaging with a growing community of more than 40,000 active procurement professionals.
Why Category Watch?

Digital first
Access category updates and insights easily, anytime and anywhere, ensuring you always have the information you need at your fingertips.

Integration of AI and human intelligence
Leverage the perfect combination of AI capabilities and human domain expertise from Beroe providing you with curated insights you can trust.

Actionable insights
Beroe goes beyond data provision. We help you identify market opportunities and risks, empowering category managers to become more resilient and competitive.

Enhanced efficiency
Compare your sourcing practices with those of the Beroe user community across multiple dimensions, such as lead time and cost savings, to identify potential areas of efficiency and better align with business objectives.

Actionable intelligence on more than 2,500 categories
Datasheet
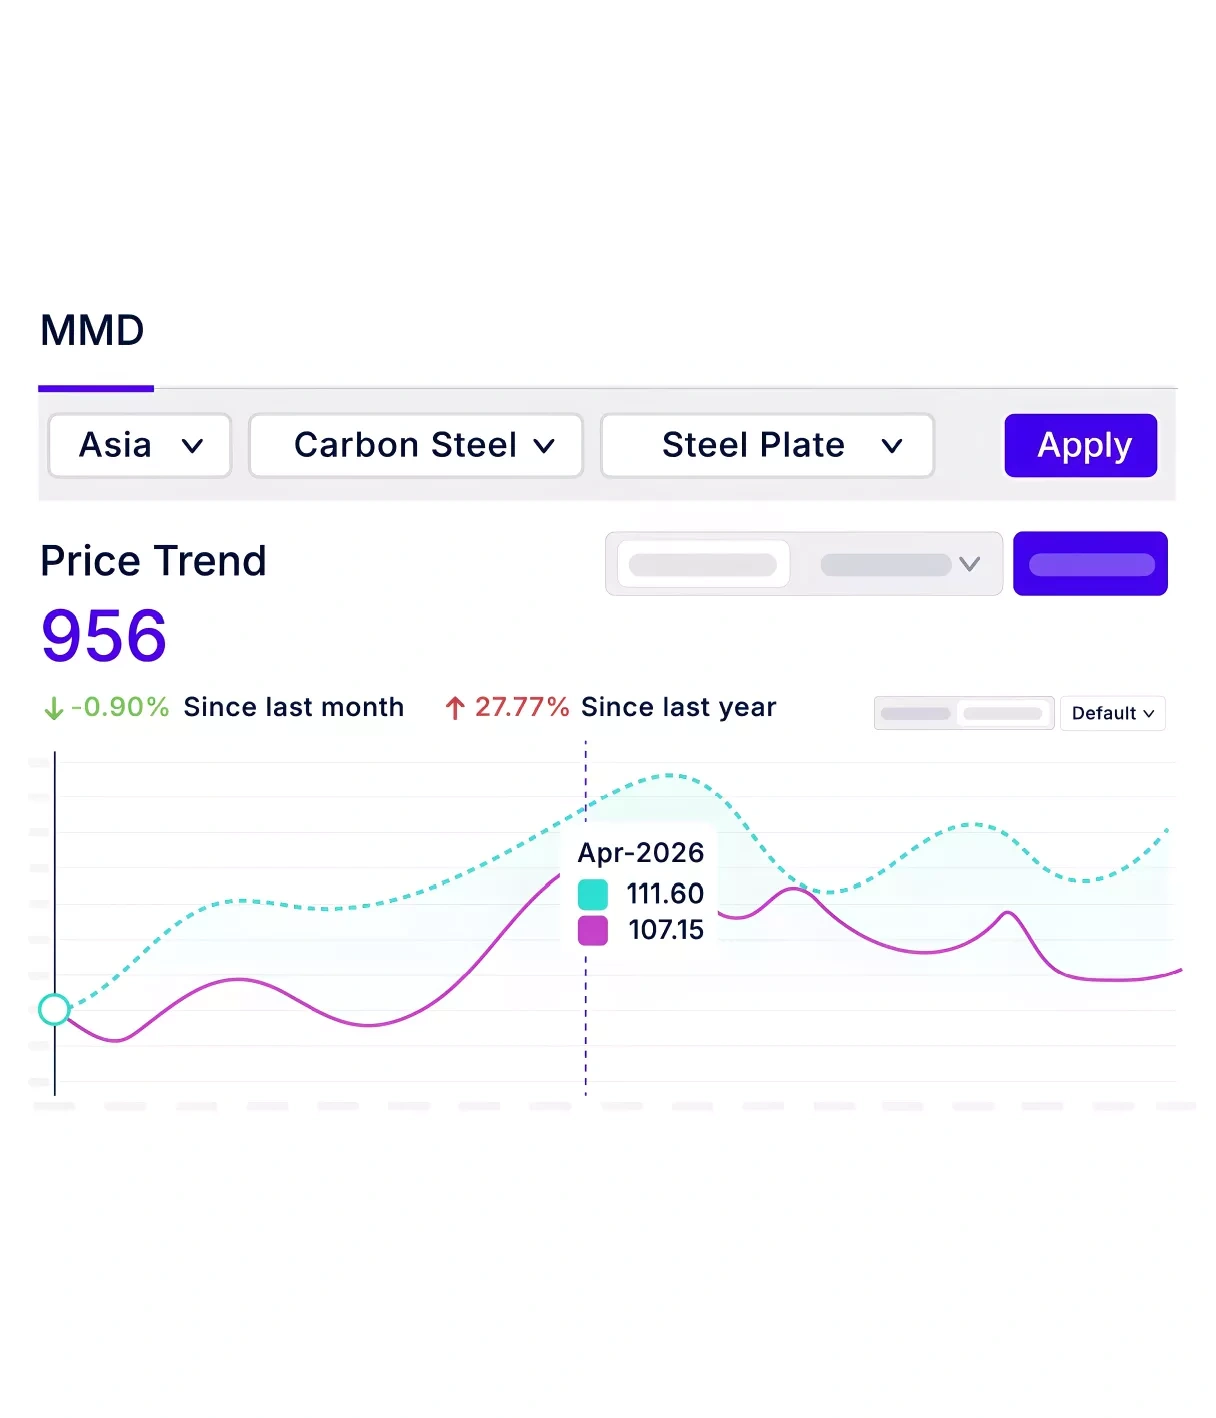
See how the Market Monitoring Dashboard, part of Beroe’s Category Watch module, helps you anticipate price shifts, control costs, and negotiate smarter with data-driven foresight.
Related Resources


Get in touch
We’re here to assist you! If you have any questions or need support, don’t hesitate to reach out. Contact us today and we’ll respond promptly to help with your needs.
Request a demo
Discover how our solutions can benefit you. Partner with us to unlock potential and drive success. Let’s work together to achieve outstanding results.