Global energy investment is undergoing a transformative shift toward clean energy, driven by technology, policy incentives, and market forces. In 2025, global energy CAPEX is projected at $3.3 trillion, with clean energy outpacing fossil fuels. This paper examines investment trends, regional patterns, and key challenges such as supply chain constraints and financing gaps, offering insights to support a resilient and sustainable energy future.
What is happening in the global energy sector today?
The energy sector stands at a pivotal point as nations accelerate the move from fossil fuels to sustainable systems to combat climate change and enhance security. Technological advances, supportive policies, and ESG-focused investment have reshaped priorities. Rising global demand and the drive toward net-zero by 2050 underline the urgency of this transition.
Fossil fuels once dominated, accounting for 60% of energy CAPEX in 2015. By 2025, total investment reaches $3.3 trillion, up 2% from 2024, with clean energy commanding $2.2 trillion covering renewables ($780B), grids and storage ($500B), and other technologies while fossil fuel CAPEX plateaus at $1.1 trillion.
Source: IEA World Energy Investment 2025
What challenges does the energy sector face in transitioning to clean energy?
Although clean energy investment grows rapidly, the $3.3 trillion projected for 2025 falls short of the $5.6 trillion needed annually by 2030 to limit warming to 1.5°C. Fossil fuel investment remains high at $1.1 trillion, sustaining reliance on carbon-intensive assets. Economic uncertainty, supply chain issues, and inconsistent policies further threaten progress toward the COP28 goals of tripling renewable capacity and improving energy efficiency by 2030.
1. Financing gap
Current global investment is insufficient to meet climate targets. To align with COP28 ambitions, renewable power CAPEX must double, and efficiency spending must triple by 2030. Clean energy’s $2.2T in 2025 must rise to $5.6T annually to stay on track for net-zero.
2. Fossil fuel lock-in
Ongoing investment in fossil assets risks carbon lock-in and stranded infrastructure. In 2025, upstream oil CAPEX declines only 6% to $400B, and coal investments continue to grow – China approving nearly 100 GW and India 15 GW of coal plants in 2024, the highest global approvals since 2015. Such trends threaten to prolong dependence on high-emission assets.
Fossil fuel investment by region, 2025E
China: 22% | United States: 18% | Middle East: 17% | India: 14% | European Union: 9% | Latin America and Caribbean: 7% | Southeast Asia: 7% | Africa: 6% | Eurasia: 2% | Other advanced economies: 1%
3. Regional disparities
Clean energy capital is concentrated in advanced economies and selects emerging markets. China leads with $600B, or one-third of global clean CAPEX, while Asia overall accounts for 40–45%. Africa, in contrast, receives only 3–5%, with 2025 investment levels a third below 2015 due to debt and limited financing support. These imbalances slow equitable energy access and increase economic vulnerability, underscoring the need for inclusive financing mechanisms.
Clean Energy Investment by Region, 2025E
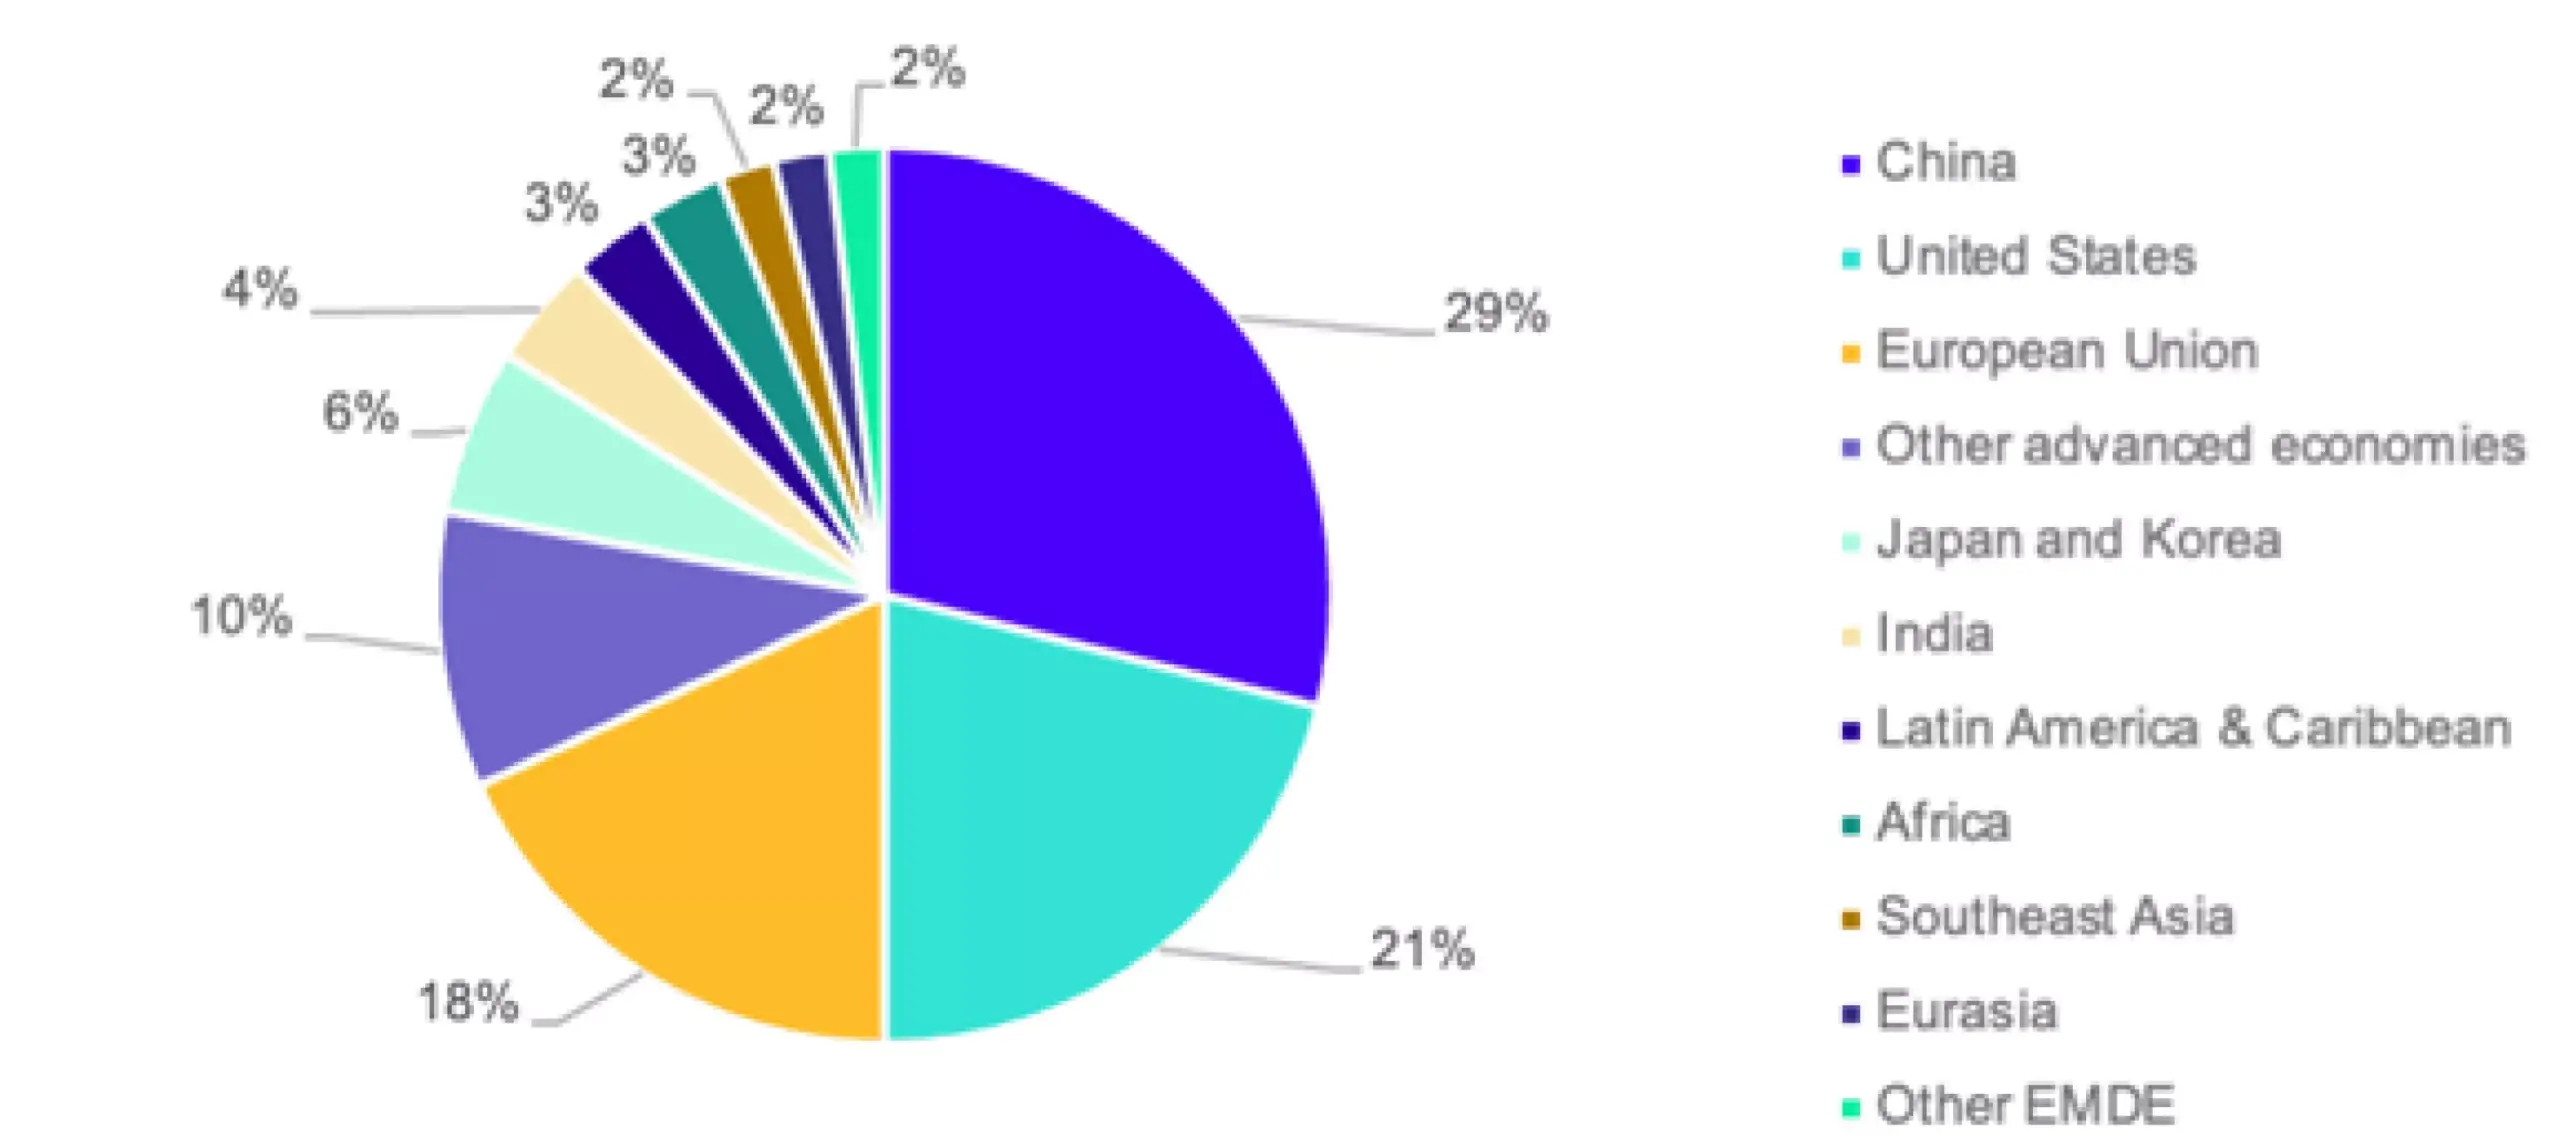
Source: IEA World Energy Investment 2025
What are the potential solutions, strategies, and impacts?
| Strategy | Key Actions | Rationale | Expected Impact |
| 1. Accelerate cost reductions in clean tech | Fast-track R&D, scale giga-factories, create shared IP/innovation pools | Break cost barriers, remove subsidy dependency, improve global adoption | Unlocks >$1T clean investment, makes clean tech cost-competitive with fossil |
| 2. Strengthen regulatory frameworks | Expand IRA/EU-style tax credits, fast-track permitting, enforce carbon pricing | Crowds out fossil expansion and makes renewables the default choice | Speeds deployment, lowers emissions curve, creates stable investment climate |
| 3. Enhance investor strategies & blended finance | Channel 60–70% climate finance to clean power, mobilize sovereign & private funds for EMDEs | Fix financing bottlenecks, ensure equitable transition in developing regions | Redirects $1.3T by 2035, accelerates COP28 pathways, de-risks emerging markets |
| 4. Foster global supply-chain cooperation | Build regional manufacturing hubs, strategic mineral alliances, clean-tech trade pacts | Reduce supply shock risk, secure critical minerals, lower input volatility | Cuts clean-tech costs 10–15%, improves resilience, enables fair access for all markets |
| 5. Reallocate corporate CAPEX & adopt digital tools | Divert 20–30% of oil/gas CAPEX to renewables, deploy AI-based optimization & predictive maintenance | Avoid stranded fossil assets, maximize asset efficiency | Reduces transition risk, speeds industry net-zero alignment, boosts productivity |
Which countries are leading the move to clean energy?
The 2025 Energy Transition Index (ETI) shows strong global progress: 65% of countries improved scores, and 28% advanced in energy security, sustainability, and equity.
Top performers – Sweden, Finland, Denmark, Norway, and Switzerland – lead through diversification, strong policies, and infrastructure.
| Rank | Country | ETI 2025 Score | Structural Strengths | Progress Highlights 2025 |
| 1 | Sweden | 77.5 | Clean energy mix, strong regulation & innovation | Led ETI with low-carbon tech, high clean job growth, strong R&D, low methane |
| 2 | Finland | 71.8 | Legally binding 2035 net-zero target, strong nuclear & renewables | Reduced fuel imports, top grid reliability, low transmission losses |
| 3 | Denmark | 71.6 | Diversified energy mix, offshore wind & hydrogen leadership | Open markets, transparent regulation, strong institutional policy |
| 4 | Norway | 71.5 | Hydro & wind–dominated grid, high EV adoption, sovereign wealth fund | High clean energy investment, world’s lowest net energy imports |
| 5 | Switzerland | 71.0 | Advanced CO₂ rules, balanced energy mix, innovation hubs | Rising renewables & clean jobs, strong carbon pricing backbone |
| 6 | Austria | 70.6 | Strong public support, large renewable deployment, integrated planning | More clean energy jobs, grid buildout supported by renewable capex |
| 7 | Latvia | 69.4 | Rapid renewable growth, modernization of grid | Top improver: +973% clean investment, lower fuel imports, high green job share |
| 8 | Netherlands | 69.2 | Strong transmission infrastructure, hydrogen-ready grid | Higher clean energy investment, reduced reliance on gas imports |
| 9 | Germany | 68.8 | Net-zero targets, innovation in hard-to-abate sectors, hydrogen infra | Ongoing coal phase-down, expanded renewable capacity, rising green capex |
| 10 | Portugal | 68.8 | Expanding renewables & hydrogen, modern grids | Cut in net fuel imports, improved affordability for industry |
Among major economies, China ranks 12th, leading in clean energy manufacturing and deployment; the US ranks 17th, excelling in security but challenged by grid reliability; India ranks 71st, advancing rapidly but constrained by financing and infrastructure.
Source: WEF Energy Transition Index 2025
What’s next for the global energy landscape?
The 2025 transition marks a decisive moment for the energy industry. Achieving sustainable growth requires accelerating clean technology adoption, closing the financing gap, and phasing down fossil dependencies. Global cooperation on supply chains, equitable financing for emerging markets, and strategic reallocation of corporate CAPEX will be pivotal. With robust policy support and digital innovation, the world can move toward a secure, inclusive, and low-carbon energy future aligned with climate goals.
Author
Raswanth TR
Related Reading


02 Mar, 2026
Why are Category Management Platforms a Gamechanger for Modern Procurement Teams

26 Feb, 2026
Navigating Risks and Opportunities in Oil Extraction: A PESTEL Analysis for Procurement Leaders