Trade weight index helps in currency adoption and provides value on procurement

Introduction:
Companies engage in many long-term transactions and currency risk is a major factor. This risk element is basically in terms of volatility risk which means significant change in exchange rate levels from one period to another and is detrimental due to losses from slippages driven by heavy currency fluctuations.
- One method to estimate the volatility risk is to use historical volatility of a currency as an indicator of the current level of volatility in the market. This also provides an understanding of the level of risk premium in the market for any particular currency. This paper intends to compare historical currency volatility across countries to have a robust picture on the risk levels of a currency.
- The other aspect is to estimate the expected risk level for any desired currency for the future, which can provide an understanding of implied volatility present in a currency.
Now exchange rate levels between two countries are directly affected by respective interest rates and inflation rates. Any country has one basic key interest rate for its economy and it also reflects the premium added to it based on future expected inflation. But interest rates can be misleading as they are controlled by central banks. Hence the yields of the sovereign bonds act as good measure of interest rates as they reflect market consensus. Also yields for multiple time frames are available reflecting different expectation for various time frames on interest rates and inflation rates. This data of yield rates is used to calculate forward rates on a currency in multiple time frames.
This paper intends to focus on a measure based on the slope curve generated by multiple forward rates of a currency which is a parameter of risk and is comparable with other currencies and also comparable with itself in different time periods. Hence this method provides a relative measure of probability of implied volatility in any exchange rate and therefore has an expectation of future values of exchange rates.
Using the current volatility and implied volatility, this paper intends to focus on how the relative levels when compared for multiple countries can give insights on selecting or discarding a currency based on its relative risk levels.
The value of a currency is another key element which needs focus when any company adopts a long-term procurement strategy. For instance, in terms of conversion to US dollars, Chilean Peso is cheaper to Brazilian Real but not in terms of value.
- The value of a currency is estimated by calculating the real effective exchange rate. Trade weighted index (TWI) is a key measurement of the same. This variable is also comparable across multiple currencies and hence provides a strong perspective on relative values.
This paper intends to focus on TWI and its effectiveness in considering any country as cost effective sourcing destination. It also focuses on certain caveats required when considering this variable. It offers insights on the use of risk and value assessment of a currency.
To focus on the above mentioned requirements concerned with currencies, we have used South or Latin America as a sample for our focus.
South America is the fourth largest continent of the world and is a major supplier of natural resources to the world and hence acts as a high importance procurement destination. The period from 2013-2014 has seen high volatility in most of the South American currencies. Although the volatility in currencies is basically a reflection of the exchange rates which are valued against the US Dollar. Notably, the US Dollar Index (an index of a basket of top traded exchange rates against the US Dollar) has been broadly stable as compared to volatilities experienced in many South American currencies.
For convenience we are only focusing on few selected currencies of this continent: Brazil, Colombia, Chile, Mexico and Peru. In referring to any currency in the paper, the country name is used synonymously for the exchange rate between the local currencies against the US Dollar.
Risk Assessment
Volatility Risk:
Volatility of any currency reflects the rate at which the exchange rate is changing from one period to another. Historical volatility is measured from past data and reflects current volatility in the market. Hence it also reflects expectations of market participants on the volatility risk of a currency.
In the below chart we have a volatility measurement customized based on Bollinger band which gives us a method to compare volatilities across currencies from 2007-2013. This can give various cues on market’s relative expectancy of the risk element in various currencies. This can provide visibility on the difference between one’s own risk assessments when compared to market.
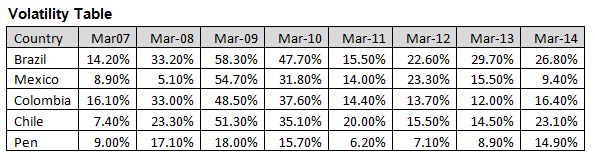
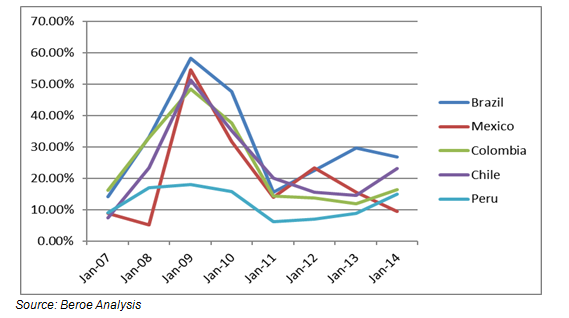
The above graph reflects that Brazil has been the most volatile currency since 2007 and Peru being the least volatile when estimated on a monthly basis. Since all the above currencies represent the same region, the overall volatility pattern is the same. But notably, Mexican currency is declining in volatility since 2012.
Hence at the given date, we conclude based on historical volatility that market participant’s expectation of risk of volatility is decreasing for Mexican currency which is contrary to other currencies which have seen a rise in volatility since 2013 especially in Chilean currency.
In a long-term trade engagement, preference to a country needs to be given based on relatively low volatility or decreasing volatility. This would have a relatively low impact from slippages in money transactions due to exchange rate fluctuations over a period of time.
Slope of Currency forwards:
In today’s procurement environment there exist a strong need to assess the risk of depreciation of a currency but more importantly it is required to be preempted to safeguard from indulging in any inappropriate procurement engagements. Again, it is crucial to have a relative assessment of depreciation risk in currencies to select the right country for any long-term trade engagement.
To gain a different perspective on future volatility expectation, we can use a custom forward curve on currencies. This should be based on yield curves of the respective countries’ sovereign bonds which will have an expectation of future interest rates and inflation rates.
The slope of this curve will provide a measurement of the risk expectancy for the currency. The slope of various currencies can be compared to gauge relative risk levels.
Calculation Methodology
The importance of slope is that it is also comparable across periods and across countries which can be crucial to select appropriate exchange rates based on one’s requirements. One can choose an appropriate hedging strategy depending on the risk element in the currency.
Hence as a thumb rule, the higher the slope there is more chance of the currency to depreciate and vice versa.
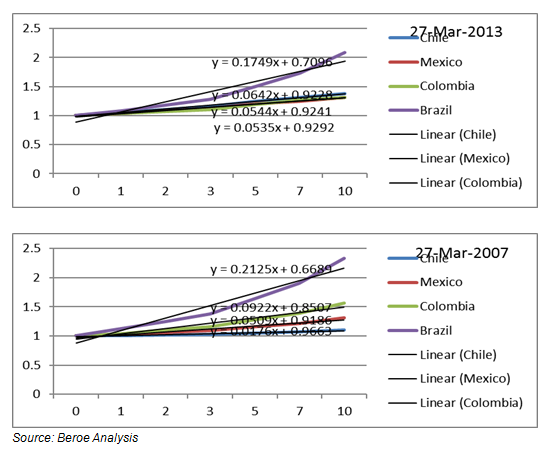
The above graph shows slopes for forward curve on currencies for 2013 and 2007 which again reflects that Brazil being expected to be the weakest currency. Note the nature of changes in slope for various currencies from 2007 to 2013. The below graph shows the change in slope for four currencies from 2007 to 2014.
Since the slope is expected to serve as an indicator of implied volatility, it is required to have an element of future expectancy of rates.
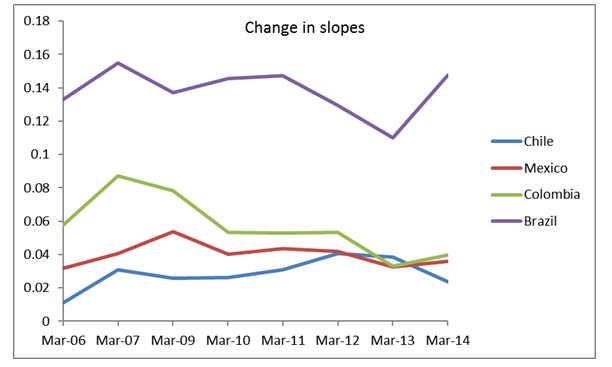
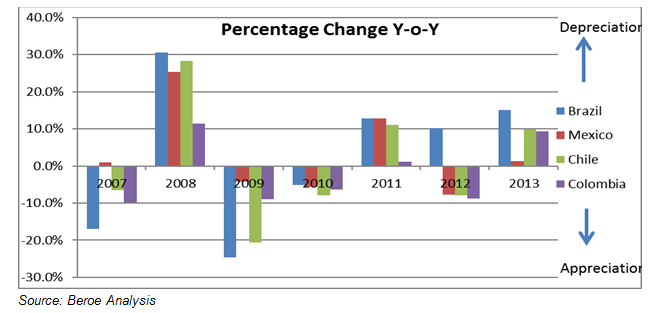
The above chart is the change of slopes from 2007 to 2014 for different currency forward curves and the next chart is the Y-o-Y percentage change in exchange rates. Since the slope of curve is for March of every year, it acts as a strong reflector for expected change in the exchange rate by end of that year. The Colombian currency saw a gradual decline in slope in this period (2007-2014) and hence witnessed the least depreciation over this period.
In March 2013, the slope curve for Chilean Peso rose above Mexican and Colombian which reflected into relatively higher depreciation for Chile by end of 2013. Thus the slope is an effective tool to measure expectancy of weakening or strengthening of a currency and can also be compared across currencies. Hence it provides key insights to select any currency for future engagement.
Value Assessment
Real effective exchange rate:
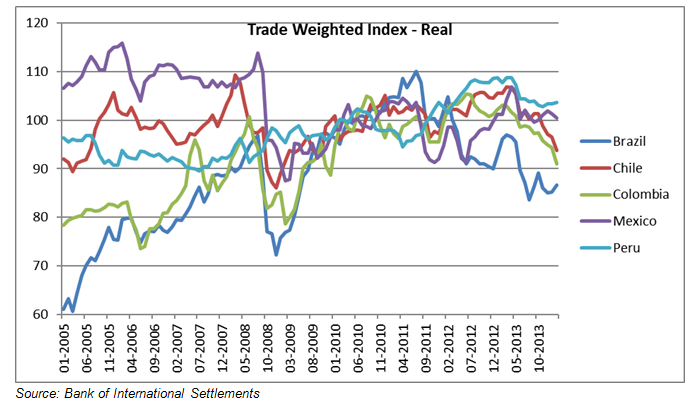
The true value of a currency is not defined by its nominal exchange rate but more appropriately from its real exchange rate. Hence we take a look at the Trade Weighted Index for various currencies which provides a clear understanding on the value of a currency comparatively.
(Trade Weight Index - TWI Calculation Methodology. Variations exist)
(A TWI is a weighted average of foreign currencies which act as its major trade partners. Weights are decided based on trade importance.)
In a typical case, if any company has to choose a destination to setup a manufacturing facility and desires a strong local functional currency for procuring cost advantage, trade weight index of the currency will provide a close measure of the value of the currency. This would mean that on a net basis the cost of procuring multiple services or materials from outside the country into the selected base country is likely to be cheaper than the other country (if it was selected as a functional currency) if it has a lower trade weighted index vale or EER (effective exchange rate).
The calculation methodology of TWI captures the trade statistics and the inflation rates to a large extent and hence can be used as a single figure to arrive at a currency value and hence a cost advantage of any country.
Higher TWI – Higher purchasing power of currency.
Lower TWI – Lower purchasing power of currency
A higher TWI is beneficial
- if specific procurement decisions are not clear to an organization, but it intends to finalize on its location strategically and wants certainty to some degree of cost advantage.
Thus the essential requirement is a strong functional currency.
A lower TWI is beneficial
- if a company sets up a base in a country and is expected to procure materials and service locally
- if a global company is expected to procure multiple goods and services and has to select one country for most of its needs, the country with a lower trade weighted index is expected to provide a strong cost advantage.
Thus the essential requirement is a weak local currency.
The TWI is extremely useful if a country plans to engage in procurement activities in places such as Europe where many countries are governed by a single currency and hence the need to select a country becomes tough on the basis of exchange rate.
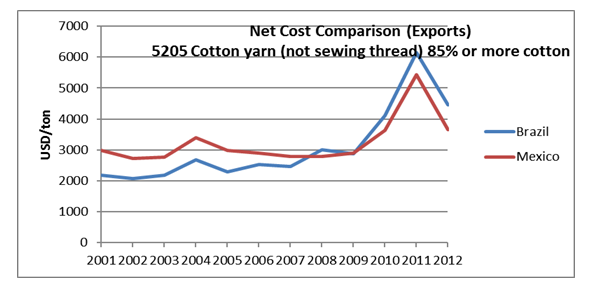
For instance, if a company exports cotton material from Mexico and Brazil over a year, the net cost of exports will be total export value divided by total exported quantity.
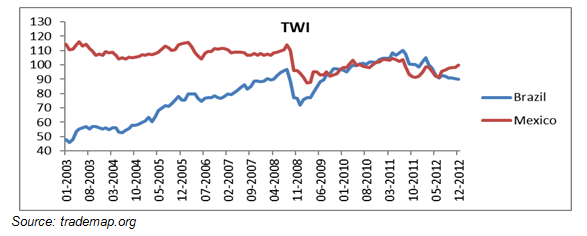
The below graph provides the net cost of the cotton yarn from 2001 to 2012. The net cost of cotton yarn was higher in Mexico as compared to Brazil from 2001 to 2007. Post that the Brazilian cotton became more expensive. During the similar period, the TWI for Mexico was higher before 2007 against Brazil’s TWI and this changed post 2007 where Brazil’s TWI was higher. A higher TWI thus reflects high value currency and hence will be an expensive option for procuring services or materials on broad level.
This factor is clearly captured in the TWI as shown left and hence to a significant extent proves the relative cost advantage of any country based on the value of its currency.
Caveats in using Trade Weighted Index:
Trade weight index reflects real exchange rate and hence has a tendency to revert to its historical mean. On an average, the overall range for the TWI for any country (with few exceptions) is from 50-150 when observed historically. Hence if country is preferred for cost advantage based on the TWI at a particular time, the trend of TWI should be declining and ideally should not be close to 50. Reverse case applies for country which is considered for a value advantage and TWI should not be close to 150.
Performance Case Study for Mar-13, Mar-12 and Mar-14
The following tables show performance of the 4 key currencies in Latin America based on the ranking from three parameters.
The highest TWI is ranked 1.
The lowest H. volatility is ranked 1.
The lowest slope is ranked 1.
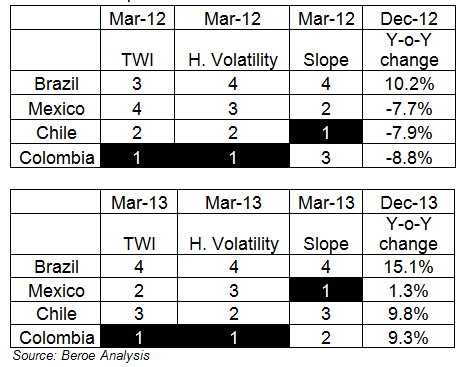
As we notice the currencies topping the three parameters performed relatively better in that particular year. This means they have been less volatile and have gained in value. Also the depreciation in these currencies has been relatively less.
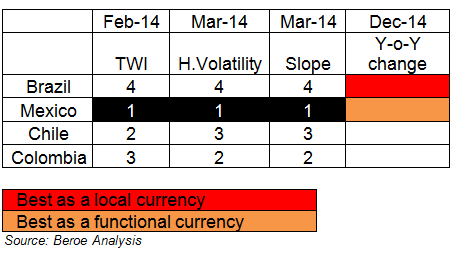
Hence considering the parameters focused above, the Mexican Peso is expected to be relatively stronger and less risky and Brazilian Real still remains the weakest currency and riskier.
Conclusion:
Large organizations adopt US dollar as their base currency. Thus a weak foreign or local currency is a key criterion when opting for a broad procurement which gives relative advantage. However, TWI acts as a key tool which actually guides on the relative value of a currency and provides its true cost effectiveness.
Also the volatility risk is an important consideration which can be observed from historical volatility. Based on the curve of currency forwards, a forward looking expectation of volatility risk can be estimated giving more insights to anticipate possible movements in any exchange rate.


Get more stories like this
Subscirbe for more news,updates and insights from Beroe