Scenario analysis helps gauge crude oil prices

Abstract
Introduction
The paper intends to retrospect the price history of crude oil in an objective manner with technical analysis principles which will lead to discover possible trends in future.
Main
The current paper will look into the last 100-150 years of crude oil history and analyse it primarily from a technical point of view. It will further complement supply side analysis and exchange-based market data to gauge the overall condition of the crude oil prices.
An attempt is made to figure possible outcomes for crude oil prices going forward with statistical rationale supported with possible events.
Recommendation
Crude oil future outlook can be used to get a perspective on energy and commodity markets as a whole. This will also be crucial in estimating possibilities for petrochemicals market.
Introduction:
Crude oil is the single most important commodity driving our daily needs. In the past several years, its usage has increased to various other demand streams. It is also the commodity most impacted by geopolitical events.
The future course assessment for crude oil prices is done based on various econometric methods; many economists also qualitatively analyse the dynamics of the commodity. This paper looks at the crude oil prices objectively in a statistical manner validated with technical analysis principles.
Further, supply side and exchange-based data analysis is done to understand the level of surplus currently governing the crude oil market.
The current paper helps to understand the possible future trends for crude oil and it is therefore necessary to hypothesize certain possibilities.
- Crude oil way forward
- Overall energy and commodity markets expectation
- Petrochemicals Impact
Crude Oil History
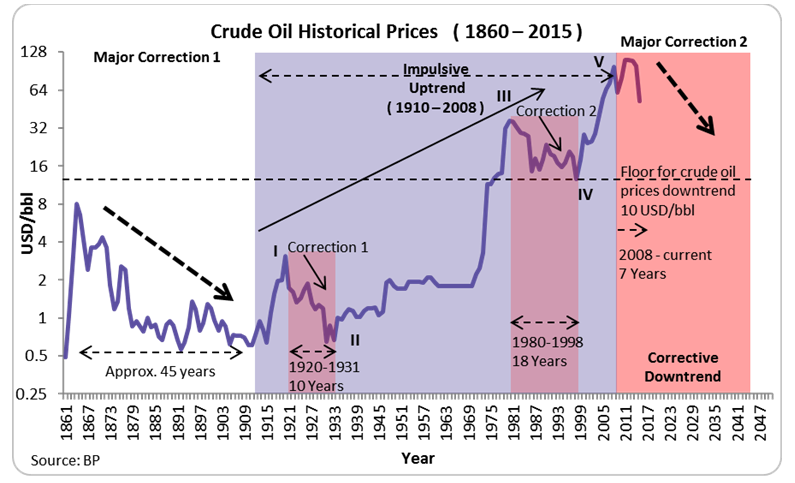
Crude oil prices have been highly volatile in the past 20 years with prices increasing or decreasing over $100. The below graph provides a snapshot of what led this price volatility.

However, when last 100 years of crude oil price history is considered, the highest volatility has been witnessed in the 1970s as prices gained the most in percentage terms for the first time.
The below graph provides us with over 150 years of crude oil price history(log chart) in contemporary US dollars (Yearly Average). Although crude oil had the biggest gain in US dollars between 2000 and 2008, the biggest percentage change was observed in the 1970-1980 period.
1. Elliot wave perspective:
The above graph provides an understanding of the nature of price increases in crude oil market over the last 150 years.
- Crude oil prices are currently undergoing a major downtrend which is expected to provide a long-term consolidation in prices after witnessing an increase for almost 100 years.
- The last two major corrections (correction1 and correction2) lasted more than 10 years. However, the current correction is expected to be of a higher duration and intensity. As the current correction which started in 2008 has completed only 7 years, prices are expected to consolidate at least till 2020.
- Hence even post witnessing any bottom in next 1-2 years, prices would be expected to stay within a range of $20-$140/bbl for the next few years (min 10 years).
From Elliot wave perspective, crude oil prices have undergone an impulsive trend from the start of 1900 till 2008 which as per theory has adhered to a five wave pattern. Post the peak oil price level in 2008, prices decreased sharply to $30/bbl and recovered back above $100/bbl. Now the recent decline in the past 1-2 years has again brought prices to 2008 levels.
Key implications from Elliot wave analysis:
- The crude oil market has clearly entered into a long-term bearish trend. Post completion of the impulsive wave, corrective waves are expected to unfold.
- The past two corrections were of lower degree wave and lasted 11 and 16 years. As the current correction has undergone for only 7 years, crude oil is expected to trade within the $16-$150 range for many more years to come. So levels significantly above $150/bbl are not expected at least for the next 10 years.
- A corrective pattern is expected to reach within the wave 4 area which range from $12-$32/bbl. Hence levels below $20/bbl can be expected at least for a short period in the upcoming years.
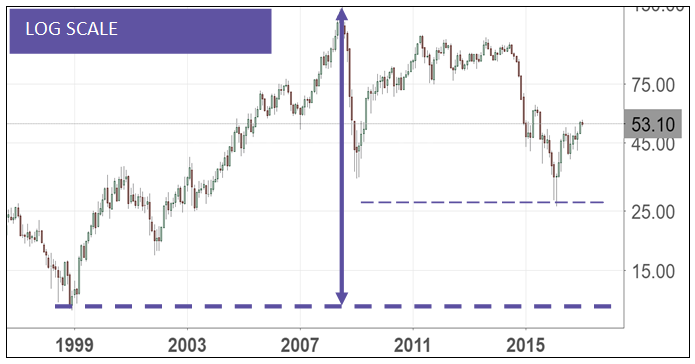
Current Scenario:
The current downtrend when diagnosed from log scaled perspective appears to be relatively less in quantum and hence more downside in prices is likely to be accounted in future.

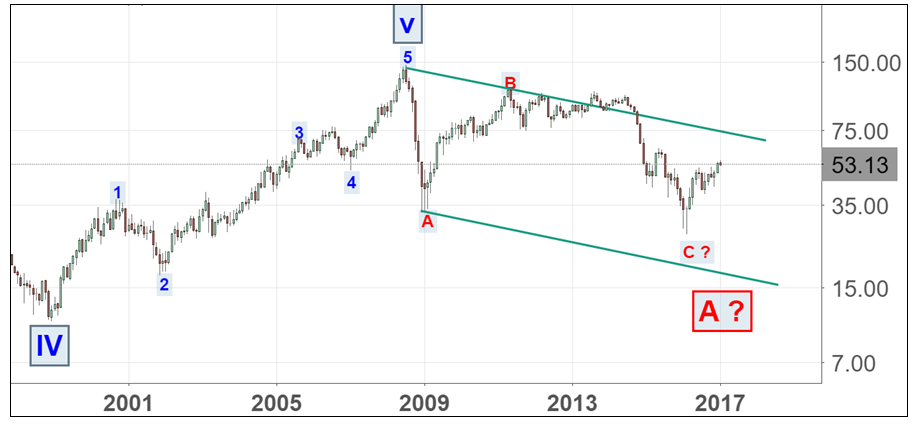
Expected Scenario:
From the above graph, we imply that the current downtrend is not complete as the overall wave C structure is not complete. Wave C will be expected to complete around the lower parallel line and hence can result in a mixed volatile trend towards lower levels of around $15/bbl. Post that we would expect to see a steady recovery which would be the next positive cycle for crude oil in the form of wave B.
Alternative scenario:
However, in the less likely scenario, if the wave C structure completes without crude oil prices going significantly below $30/bbl, a major recovery in prices can be expected and can lead crude oil back to $90-$100 levels which will be the next wave B. In this scenario, prices would not be sustainable for the long-term as the trend would only serve a larger consolidation.
Conclusion:
Based on the objective analysis, our primary expectation is that crude oil prices are currently significantly oversold and hence a recovery is expected in the short-term. The nature of recovery will lead prices to $50-$60/bbl range. Post that a further correction would lead crude oil prices lower to $20/bbl or below.
2: Supply/Demand Dilemma:
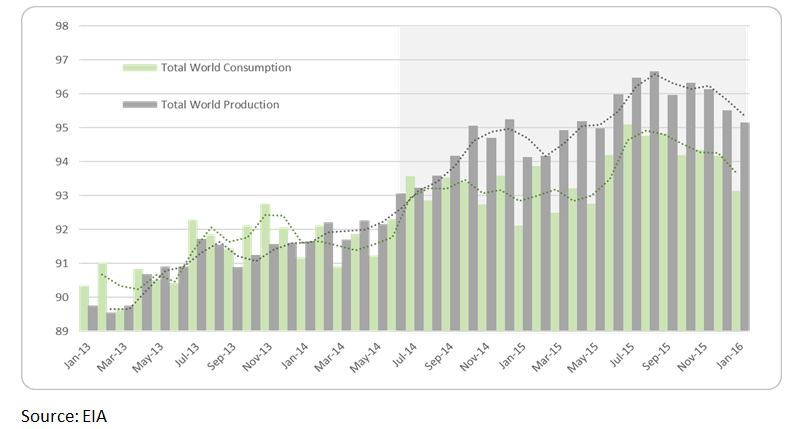
The crude oil market has witnessed a steady increase in the production levels since 2011 which has majorly come from the U.S., Canada, Russia and China. The following graph provides a comparison between total world consumption and production levels which have increased steadily post 2010. Post 2014, production levels have considerably increased above the consumption levels.
Notably, there was also a fall in consumption levels along with the decrease in production levels. This resulted in the continuity of the supply surplus in the world market.
The severity of supply surplus can be understood through the below chart which shows calculation of the summation of the total world surplus consumption. Notably, this has reached the highest point in February 2016.
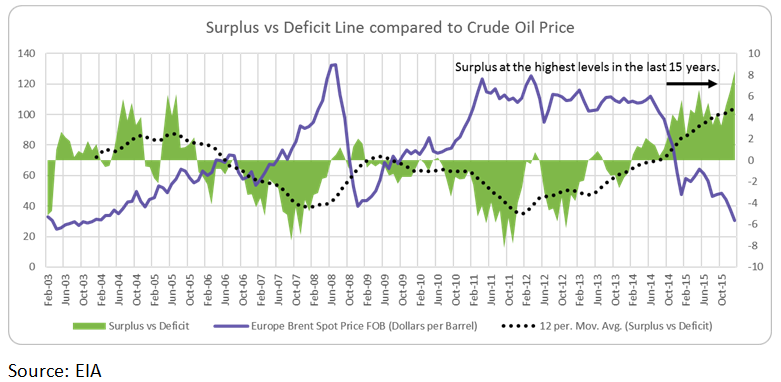
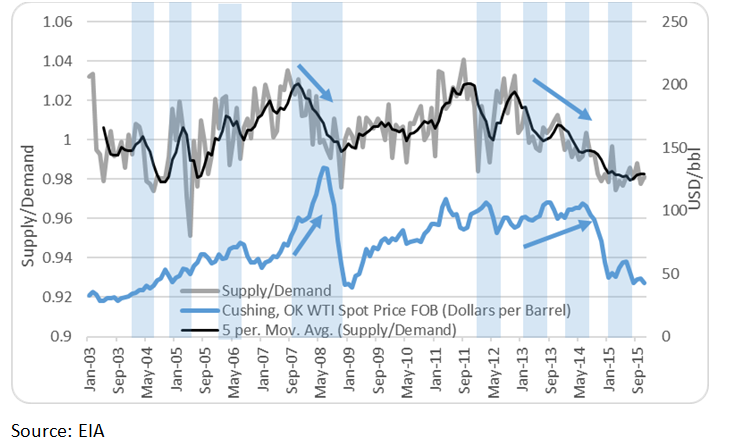
The supply/demand trend is one of the fundamental factors driving the crude oil prices; however, this has also had long periods of divergence. As depicted in the following graph prices have diverged with the supply demand dynamics.
Notably, prices tend to adhere to fundamentals when the supply/demand ratio falls below 1 which would mean an oversupply condition. But this condition was also violated in 2004-05 as prices increased despite the ratio being below 1.
Conclusion:
It is evident that supply surplus is a major concern to the overall crude oil market and it is at the highest point when observed statistically. The current supply surplus will be a constant issue as it will take a considerable time to ease out the excess surplus especially when demand is decreasing.
This is also due to the fact that major drilling operations cannot be shut instantly on a price decline as such operations are planned for several years to come and hence have to bear price variations of all types.
3. CFTC and futures market overview:
CFTC report tells us the number of future and option positions market participants have declared on the NYMEX. The crucial information is majorly captured in two categories of market participants.
· Producer/Merchant/Processor/User
· Money Manager
The following graphs show the historical data for the above two categories.
The first category shows the primary participants that are majorly into hedging activities and provide less scope for speculation in the market. The current situation clearly tells that they are net short on the market.
Now the current crude oil market is in contango and hence far away contracts are priced higher. If the spread between the far away contracts and the current spot market is large enough, the producers try to buy crude oil in spot and simultaneously sell the far away contract to make an instant profit. This is clearly evident in the short positions line in the above chart as far away contract would have been sold significantly to capture the above difference. The below table reflects the high volumes in Dec-16 and Dec-17 contracts in the derivatives market.
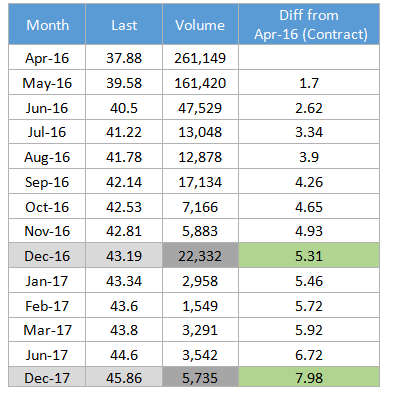
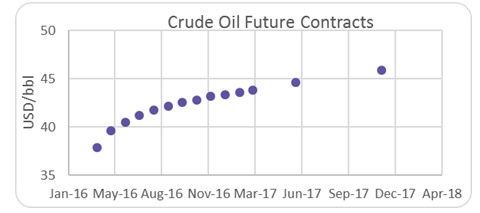
Although this does not reflect the demand, it implies a well-supplied market as a lot of crude oil stocks get piled up to lock in profit for future trade. This also explains the huge build-up in inventories in the U.S. and global markets.
However, the second category shows the market participants which are into active trading and reflect bulk of the speculative positions in the market. It is evident from the high short positions that market is bound to reverse positively in the short to medium term as further built up of positions is less likely.
Notably, even post the decrease of crude oil prices the long positions have not decreased to the extent of the bearish sentiments of the crude oil market. This figure was relatively far lower in 2008-09. Hence we expect further decrease in these speculative long positions in years to come which would correspond to further lower crude oil prices.
Conclusion:
Large speculative positions in the market are expected to decrease as they are still at considerably high levels. This on a net basis over the next 1-2 years will impact the crude oil prices negatively.
4. Way Forward:
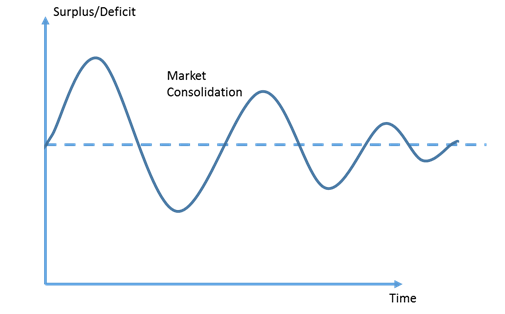
Crude oil prices have entered a phase of consolidation which is expected to last several years. This is clearly explained from a technical perspective in the previous sections.
Given the huge surplus, the overall crude oil market is expected to undergo a long structural consolidation as various crude oil refineries will need to adjust their production levels to match the demand growth which itself is deteriorating.
Possible states for crude oil for the next few years:
· Strong Supply / Strong Demand
· Strong Supply / Weak Demand:
· Weak Supply / Strong Demand:
· Weak Supply / Weak Demand:
The phases mentioned above also behave differently according to price levels.
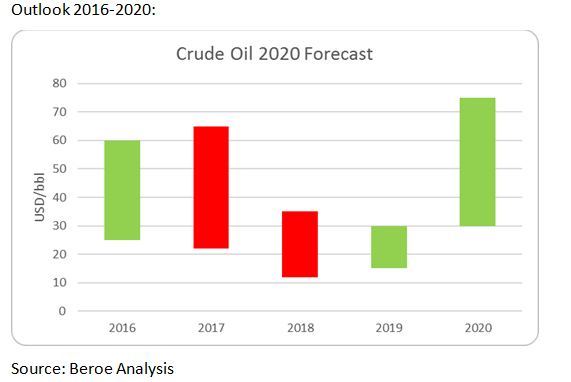
2017:
By end of 2016 to mid-2017, crude oil is expected to enter a Weak Supply / Weak Demand state which will cause huge fluctuations in price levels which will not be sustainable on either side as it will struggle to reflect fundamentals. Prices will undergo a broad consolidation at lower levels until crude oil enters a Weak Supply / Strong Demand state.
2018:
By 2018 prices would be expected to show recovery and higher levels will be witnessed and more importantly will be sustainable in nature.
2019:
2019 will be a follow up for the year 2018 with both supply and demand expected to stabilize. This will again be led by an increase in supply resulting in a Strong Supply / Strong Demand state which will not sustain as earlier fears would be prevalent in the market.
Possible scenarios:
Based on the findings, crude oil is clearly in a supply surplus condition. Moreover, demand has also come down. Prices have negatively corrected from unprecedented levels.
To understand what will lead crude oil prices forward, we hypothesize the following three aspects:
· Supply expectation
· Demand expectation
· Price behaviour or market dynamics
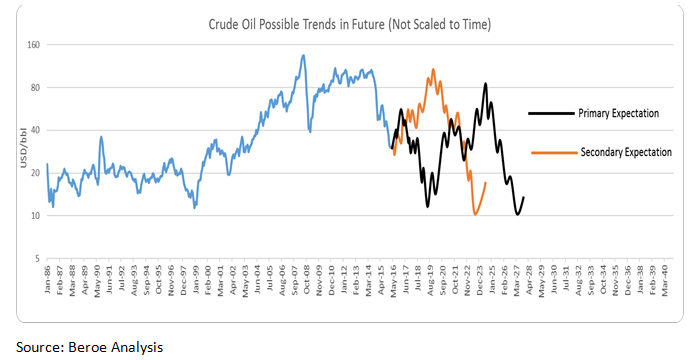
Primary scenario:
Supplies will reduce but not at the cost of market share. Current levels being extremely low will create some restrain in the supply levels. This coupled with push from the carry trade will lead to a temporary positive respite to the crude oil market.
However, growth in demand will be key in determining the price levels eventually as emerging economies are expected to go further downward phase. Demand growth is expected to take a hit in the long-run and hence will reflect negatively on prices even if supply levels go down.
Post a temporary respite, the prices are expected to further correct negatively and can go down to as low as $10/bbl. This would lead to a sharp positive correction and will spark a medium-term recovery in prices as demand would kick in with major players participating in the rise.
As prices would increase, the offshore locations and the more difficult to produce crude oil areas will come into effect resulting in an increase in supplies. Prices could be expected to reach anywhere close to $80 to $100/bbl.
Even in the long-run structural issues for the global economy will remain and hence a recovery in prices will be further met by a broad decrease in price levels resulting in broad market consolidation which will last over 10-20 years.
Secondary scenario:
Even though supply is in surplus, any geopolitical event can cause a temporary supply disruption. This could lead prices back to $100/bbl. Any major correction in the global markets led by a geopolitical or struct ural issue can also lead the same. This could be similar to the 2008 increase in price levels which occurred post a significant decrease in world equity markets.
Such an increase in price levels will not be sustainable in the long-term as supplies across the globe will be restored to capture the high levels. High prices would further hamper the demand growth which could result in a broader price decline in future. The decline could then lead prices to extremely low levels which could be in the range of $10-$20/bbl.


Get more stories like this
Subscirbe for more news,updates and insights from Beroe