CATEGORY
Crude Oil
The report covers in detail the market supply demand dynamics, supplier landscape, pricing analysis across the industries for Global Crude Oil
Beroe LiVE.Ai™
AI-powered self-service platform for all your sourcing decision needs across 1,200+ categories like Crude Oil.
Market Data, Sourcing & Supplier Intelligence, and Price & Cost Benchmarking.
Schedule a DemoCategory Alerts
Despite a rise in China's purchases of crude oil, fuel exports also increased
April 13, 2023Why did OPEC reduce its oil output?
April 07, 2023Cutting OPEC+ output is not advised, the US states
April 03, 2023Become a Beroe LiVE.Ai™ Subscriber to receive proactive alerts on Crude Oil
Schedule a DemoCrude Oil Market Monitoring Dashboard
Understand the correlation between costs, margins, and prices impacting your category on a real time basis on Beroe LiVE.Ai™
Schedule a DemoCrude Oil Industry Benchmarks
Savings Achieved
(in %)
The average annual savings achieved in Crude Oil category is 8.10%
Payment Terms
(in days)
The industry average payment terms in Crude Oil category for the current quarter is 60.0 days
Compare your category performance against peers and industry benchmarks across 20+ parameters on Beroe LiVE.Ai™
Category Strategy and Flexibility
Engagement Model
Supply Assurance
Sourcing Process
Supplier Type
Pricing Model
Contract Length
SLAs/KPIs
Lead Time
Supplier Diversity
Targeted Savings
Risk Mitigation
Financial Risk
Sanctions
AMEs
Geopolitical Risk
Cost Optimization
Price per Unit Competitiveness
Specification Leanness
Minimum Order Quality
Payment Terms
Inventory Control
The World’s first Digital Market Analyst
Abi, the AI-powered digital assistant brings together data, insights, and intelligence for faster answers to sourcing questions
Abi is now supercharged with GPT4 AI engine. Enjoy the ease of ChatGPT, now on Abi
Crude Oil Suppliers
Find the right-fit crude oil supplier for your specific business needs and filter by location, industry, category, revenue, certifications, and more on Beroe LiVE.Ai™.
Schedule a Demo

Use the Crude Oil market, supplier and price information for category strategy creation and Quaterly Business Reviews (QRBs)
Schedule a DemoCrude Oil market frequently asked questions
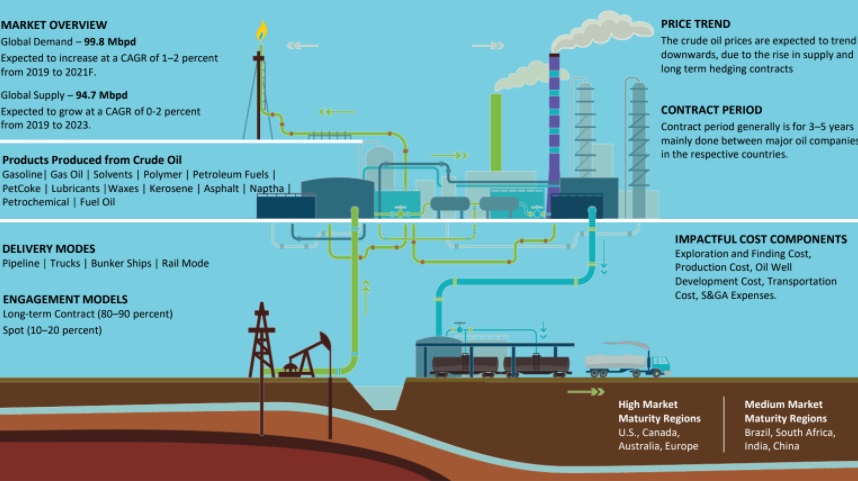
The fuel oil supply and demand in the global market stand at 92.7 Mbpd and 98.18 Mbpd (Million Barrels per day) respectively. According to Beroe's crude oil market report, the demand for fuel oil is expected to continue growing at a CAGR of 1.8 percent through 2022.
According to the crude oil market news by Beroe, it is anticipated that the crude oil prices will see a downward trend owing to the rise in supply and long-term hedging contracts.
Saudi Aramco, Sinopec, CNPC, PetroChina, Exxon Mobil, Shell, KPC, and BP are the top service providers for the global crude oil market.
The US, Canada, Australia, and Europe are the high market maturity regions, while Brazil, South Africa, India, and China are the medium market maturity regions for crude oil.
The following products can be prepared from crude oil ' gasoline, gas oil, solvents, polymer, petroleum fuels, petcoke, lubricants, waxes, kerosene, asphalt, naptha, petrochemical, fuel oil.
In 2018, the highest per capita consumption of crude oil was from NAM and the Middle East with over 2.5 tons per capita followed by Australia, Japan, and the Netherland within the range of 1.5 tons to 2.5 tons per capita consumption.
From the 2018 crude oil market analysis by Beroe, the total reserves of crude oil over the world were at 1729 thousand million barrels, marking an increase of 0.1 percent from the total reserves in 2016. About 85.7 percent of the contribution to the global reserves came from non-OECD countries while 14.3 percent of the total proven reserves were contributed by the OECD countries.
The supply and demand for crude oil in the global market has been stable and has sustained above 100 million barrels. The implied surplus line is sloping sideways and the high relative levels of the surplus will weigh negatively on the prices of crude oil.
The major demand centers of crude oil in Asian market are India, China, and Korea. These regions are also the major driver of crude oil prices.
The US imports crude oil from Canada and Mexico, while the European oil imports come from Russia, other FSU countries, the Middle East, and North Africa.
Crude Oil market report transcript
Crude Oil Global Market Outlook
-
The global crude oil supply is expected to be 101.9 Mbpd in 2023*
-
The global crude oil demand in 2022 was 99.6 Mbpd and is expected to reach more than 102 Mbpd in 2024*
-
Demand is expected to increase at an annual rate of 2-3 percent in the coming 1-2 years
Crude oil market size
-
Global Production: 99.6Mbpd (2022)
-
Global Demand: 101.9 Mbpd (2023)*
-
Global Demand CAGR: Approx. 2-3 percent (2023–2024)*
Crude Oil Proved Reserves Globally
-
The total proven crude oil reserves globally in 2021 is estimated to be 1.74 billion barrels, which is slightly higher compared to 2020 reserve estimates
-
The OECD countries contributes about 15 percent of the total proven reserves globally, whereas non-OECD countries contributed about 85 percent
Distribution of Proved Crude Oil Reserves from 1995 to 2019
-
The global proved oil reserves is estimated to remain stable at about 1.74 billion barrels in 2022 when compared to 1.735 billion barrels in 2020
-
Reserves have remained nearly stable during the period 2018-20, and it is likely to improve marginally for 2021 as exploration activities have gradually picked up pace
-
OPEC countries continue to hold the largest share (85.3 percent) of global proved reserves
-
On a regional basis, South and Central American reserves have the highest R/P ratio of 151 years
Per Capita Consumption of Oil in 2022
-
The highest per capita consumption in 2022* (estimated) for crude oil was from NAM and the Middle East with over 2.5 tons/capita
-
Australia, Japan, and the Netherlands stood in the next level of per capita consumption, from 1.5 tons to 2.5 tons
-
Chile and Colombia stood at a higher rate of consumption per capital levels, at 1–1.5 tons in LATAM
-
In 2022, the per capita consumption would be 1–3 percent higher, owing to the demand spike after the ease in pandemic restrictions
Global Crude Oil Supply and Demand Analysis
Oil Market Analytics
-
Supply–Demand: US crude oil production continues to remain around 12 to 12.1 mbpd, reflecting challenges in increasing production levels. US crude oil inventory levels remained stable at lower levels around 420 million barrels. Overall inventory levels in the SPR facility continue to decline in Dec-22. U.S. oil recounts were reported around 620 levels in recent weeks.
-
OPEC Supply: OPEC is not likely to increase production in the long term to contain oil prices, and hence, result in a recovery in oil prices in recent weeks. Expectations of Chinese refinery demand improving to serve European consumption, especially in the upcoming winter season, further supported the oil prices.
US Oil Production sustain all-time high levels:
-
US Production: The levels remain close to 12 mbpd, as rig counts have increased to 580 plus levels
-
US Inventories: US inventory continues to trend below 420 million barrels, as export demand remains consistently close to 4 mbpd
-
US Exports: The exports have witnessed volatility on global uncertain demand conditions. Overall, exports continue to trend within 3–4 mbpd, as OPEC production cuts persisted in H1 2021
-
Increasing Rig Counts: The US rig counts have increased steadily to support higher production levels, as external demand remains strong
-
US Dollar has witnessed appreciation, on the account of global geopolitical crisis, even as crude oil prices remain high
Sustainability Best Practices: Case Studies
Offshore Wind Energy-Norway
-
Supplier has decided to invest on an offshore wind energy project of 88MW capacity
-
This project, with 11 wind turbines are expected to provide renewable energy to the five platforms in the region
-
The project is worth $550 million, and would come online by 2022
Emission Management
-
The supplier has been utilizing the support of cameras to identify leakages and emissions and curtail the same
-
Drone mounted cameras are used in U.S. and Oman operations to measure methane emissions from operations
-
The cloud imaging camera quantifies the leak and sends an automated alert to the control room
Waste Management-Australia
-
Supplier has partnered with a local waste management firm, for waste disposal at its floating liquefied natural gas (FLNG) facility
-
The recycling around 613 tones of waste from FLNG facility, which is 70 percent of the project’s total waste
Crude Oil Price Forecast: Outlook
-
WTI crude oil prices are expected to average around 80.5 $/bbl. in Feb-23, with the overall trend remaining stable. Decline in US crude oil production growth rate, coupled with decrease in exports trend, is expected to reflect negatively on oil prices. Higher US interest rates are expected to further reflect negatively on the crude oil demand growth rate in the short term
-
Positive trend in the US stock markets and relatively weak US Dollar trend are expected to support demand growth rate and hence, it can help stabilize oil prices in the short term
-
Crude oil prices are expected to average around 85.5 $/bbl. in Feb-23 on expectations of demand recovery in China in the short to medium term. As production levels by OPEC are further decreased, it is expected to provide optimism over increase in oil prices. However, risk of further increase in interest rates in Europe is expected to keep overall demand growth rate levels stable. This environment is expected to result in overall stable trend in the crude oil prices, as both supply and demand growth rates are weakening
Interesting Reads:
Discover the world of market intelligence and how it can elevate your business strategies.
Learn more about how market intelligence can enable informed decision-making, help identify growth opportunities, manage risks, and shape your business's strategic direction.
Get Ahead with AI-Enabled Market Insights Schedule a Demo Now