Points to ponder while forecasting metal prices: a primer for procurement teams

By Professor Fernando Oliveira, ESSEC Business School, in association with Sakthi Prasad, Beroe Inc.
In our previous blog, we had seen how forecasting can come in handy for category managers in charge of procurement. Any uncertainty induced by forecasting models will only add to the list of anxieties.
It is important for category managers to have robust forecasting techniques at their disposal. This is because procurement budgets usually have plenty of numbers that are derived out of forecast.
Category managers also use forecasting models to validate the metal prices quoted by their suppliers. A robust forecasting model, which produces near-accurate prices, will help them to better negotiate with suppliers. On the contrary, a wrong or an inaccurate number can lead to confusing outcomes.
We had previously seen how both traded and non-traded commodities were afflicted by volatility; and also how during volatile times both linear and non-linear regression models won't be of much use to forecast price of commodities.
Besides commodities, even metal prices have been very volatile in the last few years. As can be seen in Figure 1 the prices of aluminum copper, gold, lead, silver and zinc seem highly correlated.
During the 1990s the prices were stable and also there was a slight downward trend. However, ever since 2002 there has been a dramatic change in the market prices. The increase in the level of the average price index, which reached a maximum of 354 by April 2011, was also accompanied by increased price volatility with strong swings.
Gold, lead and silver prices have traded at over 4, 5 and 8 times their prices in 1989, respectively. At the same time, in the past year or so, it seems that the market has switched to pre-2002 conditions and the average price index has stabilized just below the 250 mark.
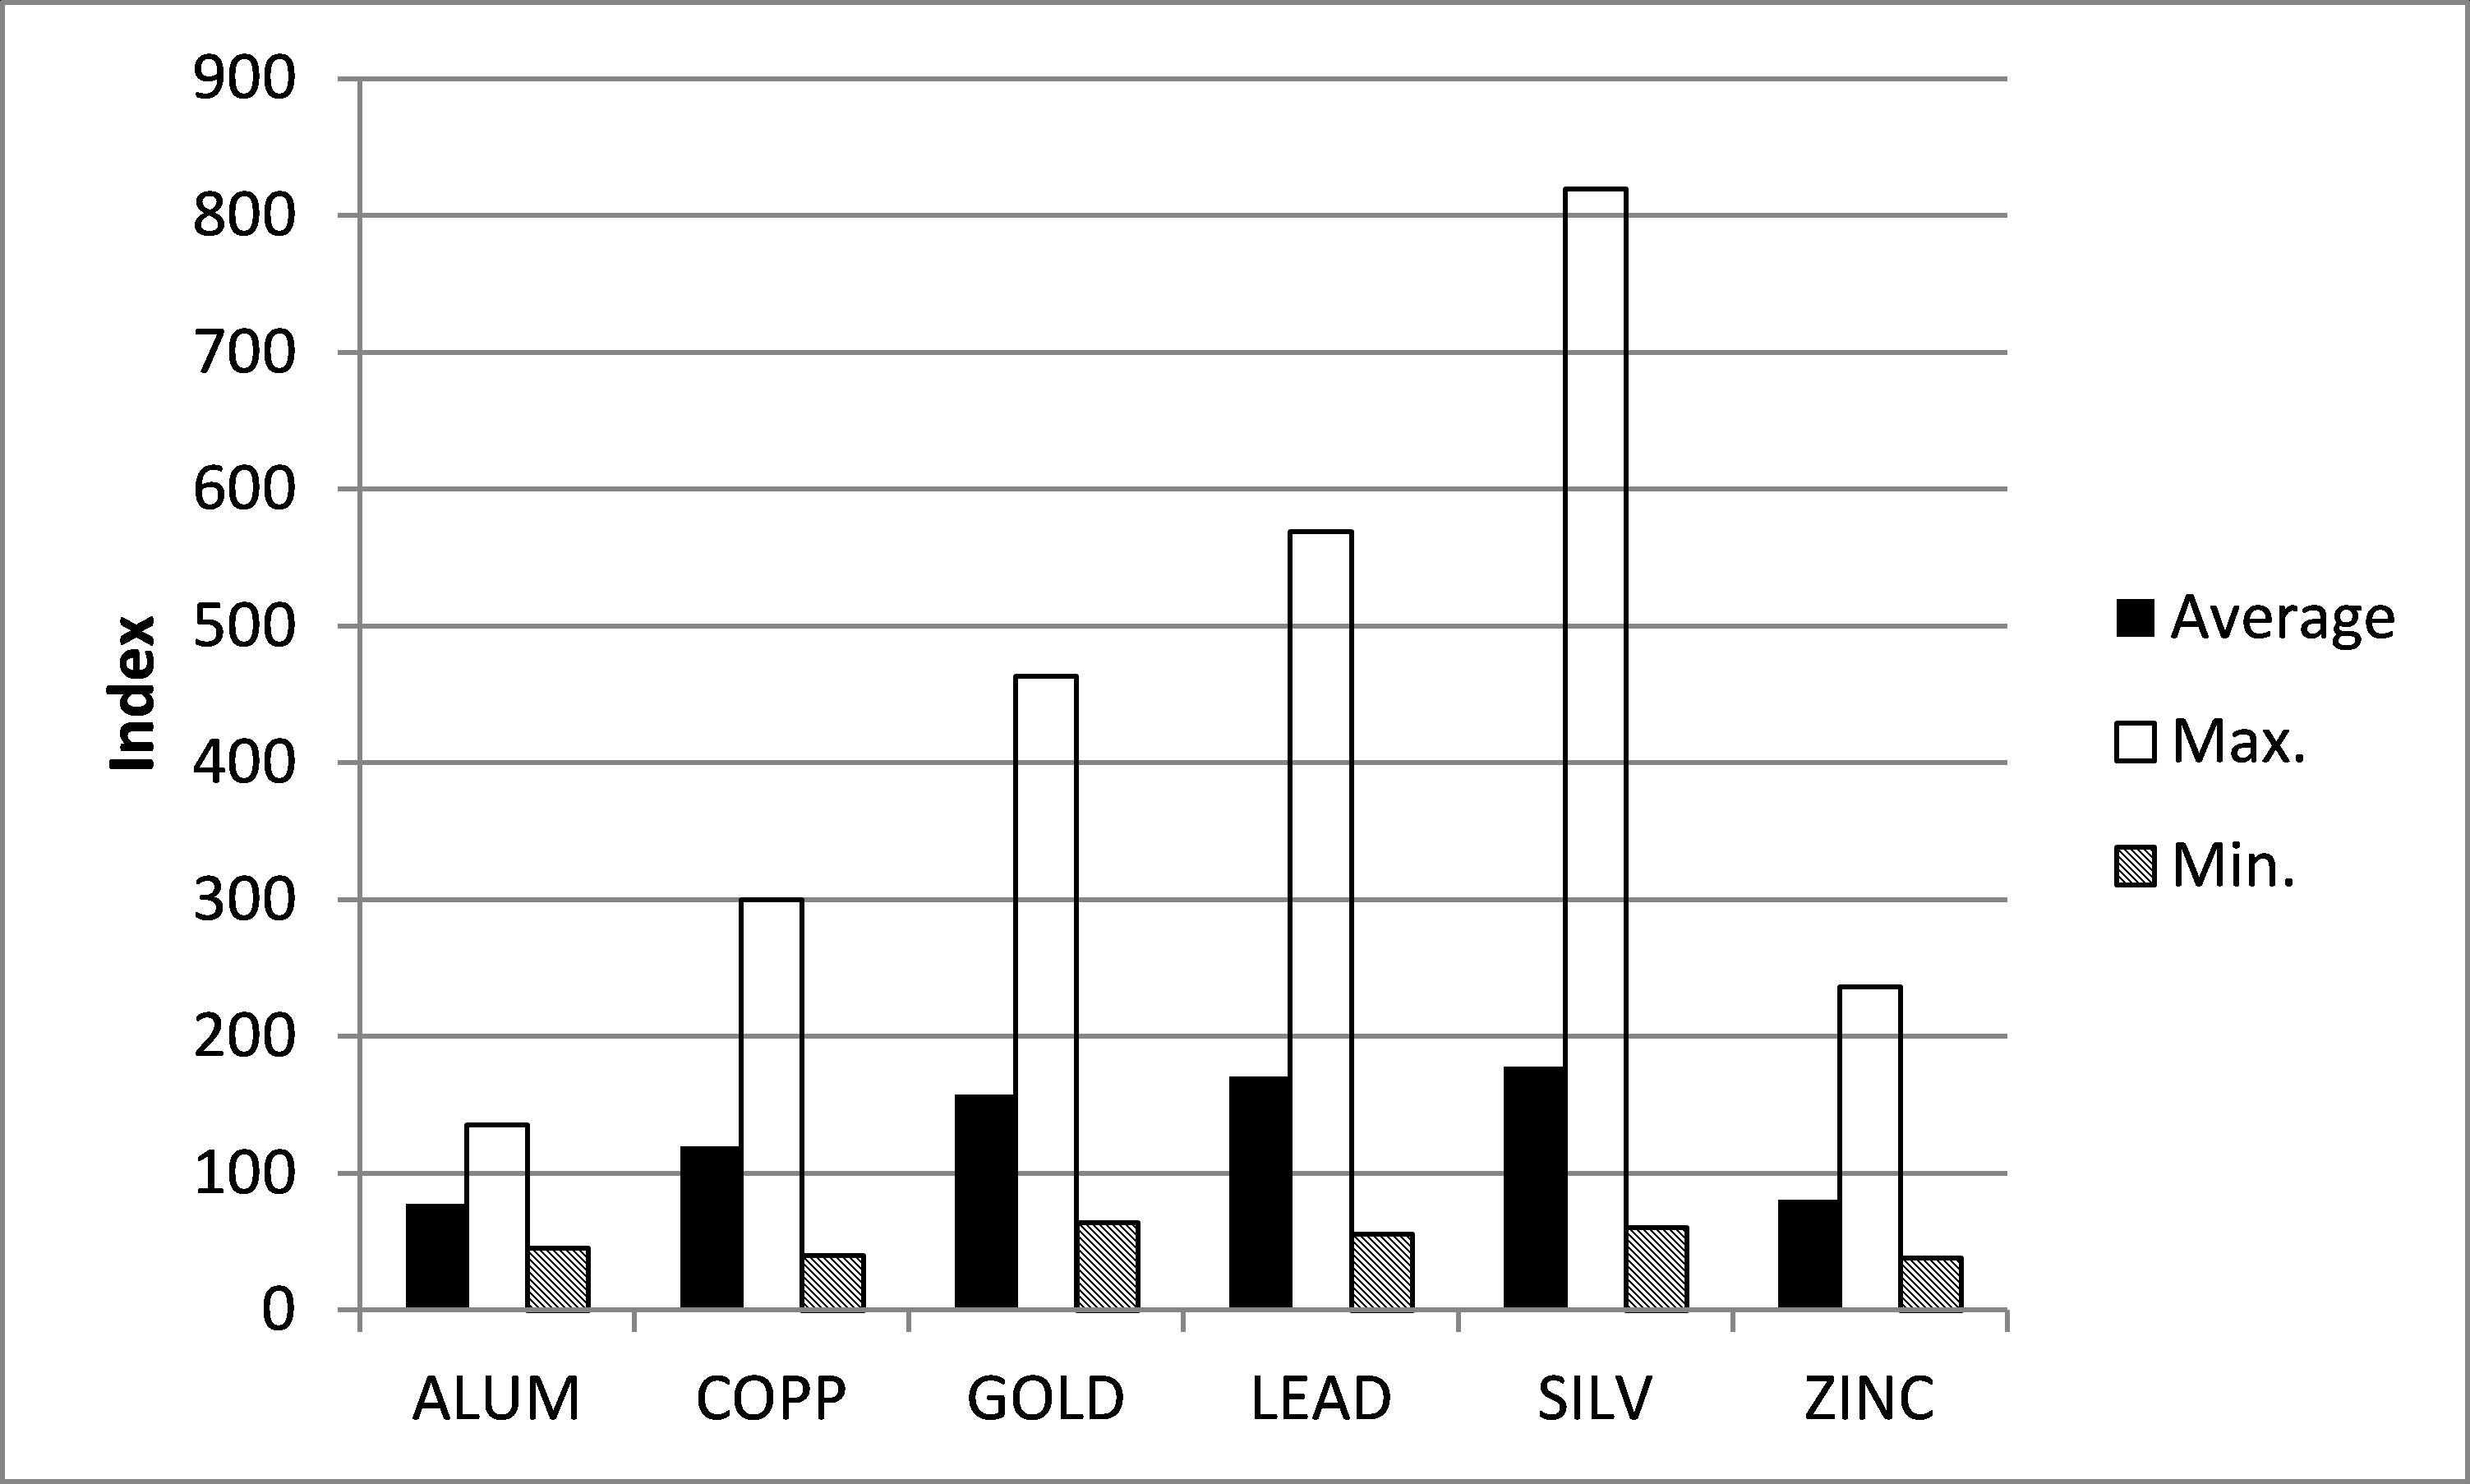
As can be seen in Figure 2, Aluminum and Zinc during the period in analysis have, on average, traded below their respective prices in January 1990 and have been much less volatile than the other metal prices.
Figure 1: Average Monthly Metal Price Indices based on January 1989.
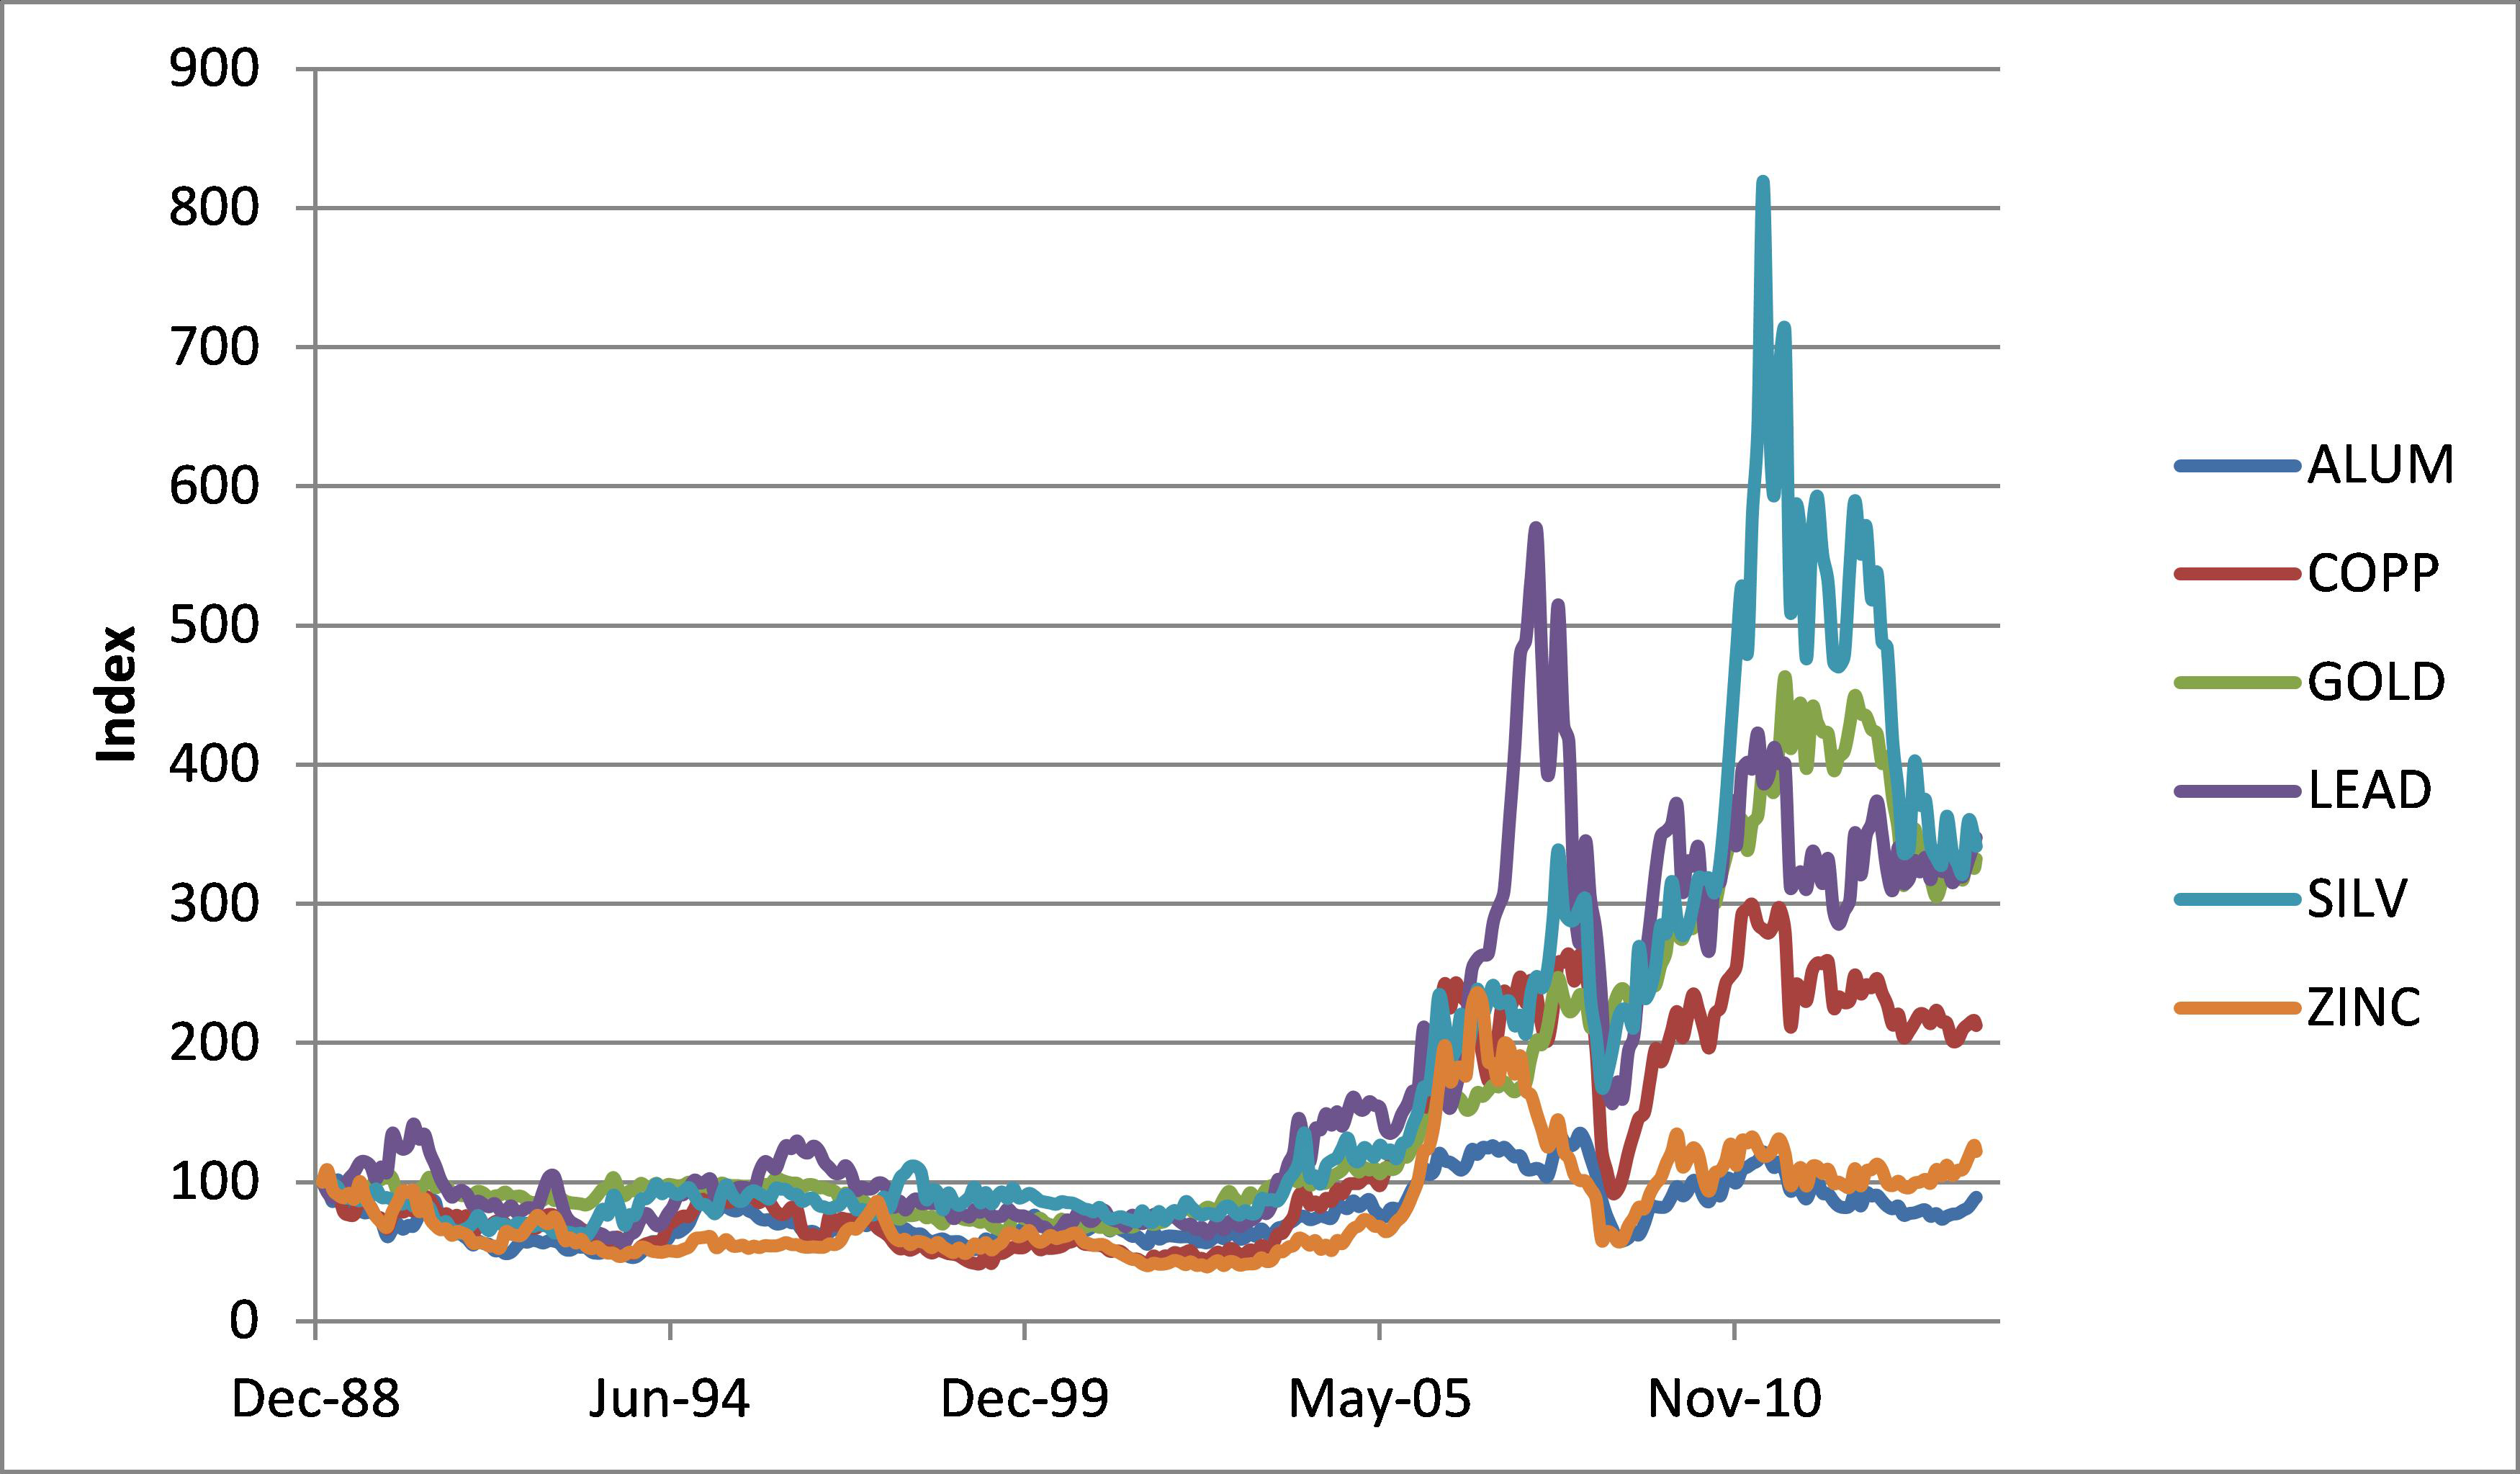
Figure 2: Average, Maximum and Minimum Monthly Metal Price Indices based on January 1989, per Metal.
Now what does these two charts mean for procurement teams?
From the perspective of category managers, who are in charge of procuring these metals for various end use industries, silver, lead and gold have presented the largest gain opportunities with the maximum prices reaching about 13, 10 and 7 times the minimum price in the period between 1990 and 2014.
In this context, for category managers directly procuring these metals, the value of an accurate forecast may indeed be very high. On the other hand, for procurement teams in companies using some of these metals as part of their production process, an accurate forecast is important to improve the estimation of production costs and the setting of the final product prices.
It therefore seems plausible that the use of forecasting tools to improve forecasting accuracy of metal prices can have an important role in value creation.
A first approach to such a forecasting system would be to consider the price of futures contracts. It has been argued that these are unbiased estimates of the spot prices at the end of the contract. There is, however, evidence in some markets that the prices of future contracts are biased and, in certain cases, not reliable estimates of the spot prices.
Procurement team need to note that in cases where markets are not fully efficient, at least in the short-run, time series methods may be useful in improving the quality of the forecasts provided by the futures prices.
For example, GARCH models, which explicitly model volatility, are useful during volatile times to improve on the forecasts of spot prices. The forecast of volatility is used to improve the confidence and prediction intervals, the width of which is conditioned on the volatility estimates, and in GARCH-M models the point estimates are also affected by the conditional volatility -- for example, increased volatility may be associated with price decreases (or vice-versa).
The use of cointegration models based on the idea that there is a stochastic process of a nonstationary nature, the underlying behavior of some of the prices means that in the long run these tend to evolve together, maintaining between them a stable relationship. This means that even if a given price has a given probability of moving either up or down, if prices are cointegrated than the long-term relationship is actually stationary and may be forecasted with a better degree of accuracy: this long-term relationship, in many cases, is the information procurement managers require in their decision process.
The discovery of such relationships, which seem evident just from a visual inspection of some prices in Figure 1, can also be used to create value not just by analyzing how metal prices co-evolve but also how to use future prices, which in many cases are cointegrated with spot prices, in order to improve our forecasts of the latter.
Such complex models need deep analytical expertise to pull out all the stops. Procurement teams in charge of purchasing metals can either employ such expertise in house or hire external consultants to run the numbers for them. To sum up: deep analytical expertise is required to improve the accuracy of forecast especially during times when multiple variables come into play.


Get more stories like this
Subscirbe for more news,updates and insights from Beroe